
To track workflow metrics for continuous improvement, start by automating data collection from project tools to save time and reduce errors. Use visual dashboards to clearly see trends and spot bottlenecks. Set regular review routines to analyze key indicators like cycle time and throughput, then act quickly on insights. Combining automation with visualizations keeps you informed and ready to improve, and if you continue exploring, you’ll discover even more ways to optimize your processes.
Key Takeaways
- Automate data collection from project management and time-tracking tools for accurate, real-time metrics.
- Use visual dashboards like charts and heat maps to identify trends and pinpoint improvement areas quickly.
- Establish regular review routines to analyze key metrics such as cycle time, throughput, and error rates.
- Implement automated alerts for significant metric changes to enable prompt action and adjustments.
- Leverage data insights to optimize workflows, reduce waste, and support continuous process improvements.

To achieve continuous improvement in your workflow, you need to regularly track and analyze key metrics and analytics. This process helps you identify bottlenecks, measure progress, and make data-driven decisions. One effective way to do this is by implementing automation strategies that streamline data collection and reporting. Automation reduces manual effort, minimizes errors, and guarantees you have real-time insights at your fingertips. For example, integrating tools that automatically gather data from your project management system or time-tracking software allows you to stay updated without constant manual input. This way, you’re free to focus on interpreting results and making improvements rather than gathering data.
Automate data collection to save time, reduce errors, and gain real-time insights for continuous workflow improvement.
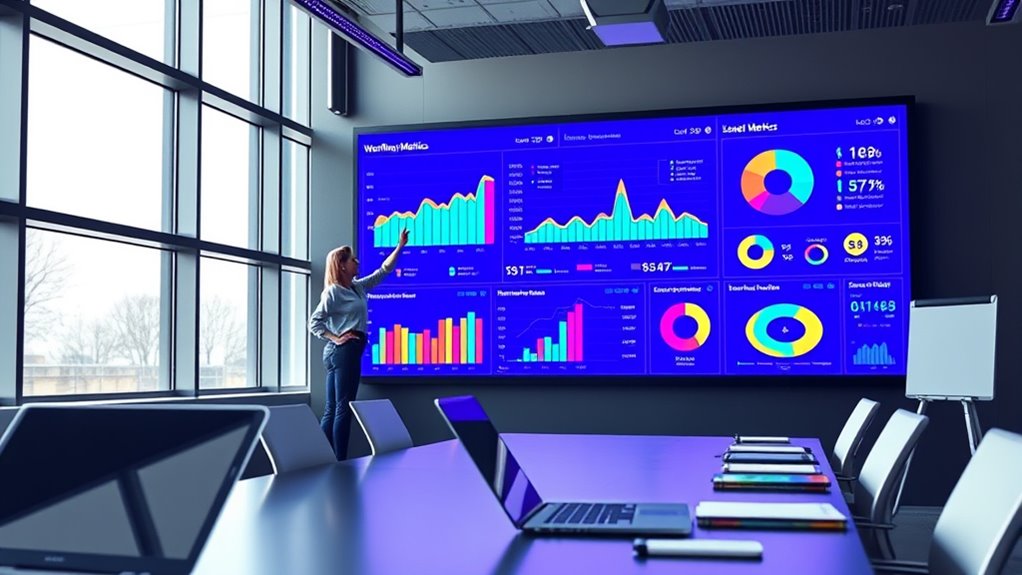
Once you have your data, visualization becomes essential. Data visualization techniques turn complex numbers into clear, understandable visuals that reveal patterns and trends instantly. Bar charts, line graphs, heat maps, and dashboards can help you quickly pinpoint where your workflow is thriving and where it needs adjustment. Visual representations make it easier to communicate findings with your team and foster a shared understanding of your performance metrics. With good visualization, you can spot inefficiencies or areas for growth at a glance, enabling faster decision-making and targeted improvements. Incorporating effective data visualization techniques can further enhance your ability to interpret metrics accurately.
To make the most of your analytics, you should establish a routine for reviewing these metrics regularly. Set aside specific times—weekly or monthly—to assess your dashboards and reports. During these reviews, look for shifts in key indicators, such as cycle time, throughput, or error rates. When you notice deviations or declines, dig deeper to find root causes. Sometimes, automation strategies can be adjusted to better capture relevant data, or new visualization techniques can be employed to highlight emerging issues. Consistent review not only keeps you informed but also cultivates a mindset of continuous improvement, where data is a fundamental part of your workflow evolution.
Additionally, combining automation strategies with effective data visualization techniques enhances your ability to act swiftly. Automated alerts can notify you of significant changes, while visual dashboards provide context and insights at a glance. This synergy ensures that you’re not just collecting data but also making it useful and actionable. Over time, this approach helps you fine-tune your processes, reduce waste, and optimize productivity.

Power BI for Project Managers: Build Real Project Dashboards, Automate Reports with AI, and Transition from Excel Step-by-Step
As an affiliate, we earn on qualifying purchases.
As an affiliate, we earn on qualifying purchases.
Frequently Asked Questions
How Often Should Workflow Metrics Be Reviewed?
You should review workflow metrics regularly, ideally on a weekly or bi-weekly basis, to guarantee a consistent frequency assessment. Establish a review cycle that aligns with your team’s pace and project demands, allowing you to identify bottlenecks and make adjustments promptly. Frequent reviews help maintain peak performance, prevent issues from escalating, and support continuous improvement. Adapt the review cycle as needed to keep your workflow efficient and responsive.
Which Tools Are Best for Real-Time Analytics?
Imagine you’re managing a busy customer support team. You’d want instant updates, right? Tools like Tableau or Power BI offer real-time dashboards and analytics platforms that give you immediate insights. They help you monitor key metrics, identify bottlenecks, and respond swiftly. These tools are ideal for continuous improvement because they provide accurate, up-to-the-minute data, enabling you to make informed decisions and optimize workflows on the fly.
How to Ensure Data Accuracy in Workflow Tracking?
To guarantee data accuracy in workflow tracking, you should implement data validation at each data entry point, making sure information is correct before it’s stored. Additionally, conduct regular audit procedures to identify and correct discrepancies, maintaining data integrity. Automating validation processes reduces errors, while audits help catch issues early, ensuring your metrics truly reflect your workflow performance. This approach keeps your analytics reliable for continuous improvement.
Can Metrics Be Customized for Different Teams?
Yes, you can customize metrics for different teams using team-specific metrics and customization strategies. By identifying each team’s unique goals and workflows, you tailor the KPIs to mirror their priorities. Implementing strategies like flexible dashboards, adjustable targets, and team-focused data filters guarantees relevant insights. This approach helps teams stay aligned, track progress effectively, and foster continuous improvement tailored to their specific needs.
How to Motivate Staff to Improve Based on Analytics?
You can motivate staff to improve based on analytics by offering employee incentives that reward progress and achievement. Regular feedback loops help staff see their growth and understand areas for improvement, boosting motivation. Celebrate milestones, provide constructive feedback, and link incentives to specific metrics. This approach keeps employees engaged, fosters a culture of continuous improvement, and encourages them to use analytics as a tool for personal and team success.

Advanced Data Analytics with AWS: Explore Data Analysis Concepts in the Cloud to Gain Meaningful Insights and Build Robust Data Engineering Workflows … (Data Analyst — AWS + Databricks Path)
As an affiliate, we earn on qualifying purchases.
As an affiliate, we earn on qualifying purchases.
Conclusion
By consistently tracking your workflow metrics and analytics, you’ll open the power to transform your processes like a master conductor directing a symphony. Every insight you gather becomes a stepping stone toward perfection, turning chaos into clarity. Embrace continuous improvement as your guiding star, and watch your efficiency soar to heights you never imagined possible—like an unstoppable force rewriting the very limits of productivity. Keep refining, keep growing, and let your workflow shine brighter than ever.

Automated Data Collection with R: A Practical Guide to Web Scraping and Text Mining
As an affiliate, we earn on qualifying purchases.
As an affiliate, we earn on qualifying purchases.

Time Series Analysis with Python Cookbook: Practical recipes for the complete time series workflow, from modern data engineering to advanced forecasting and anomaly detection
As an affiliate, we earn on qualifying purchases.
As an affiliate, we earn on qualifying purchases.