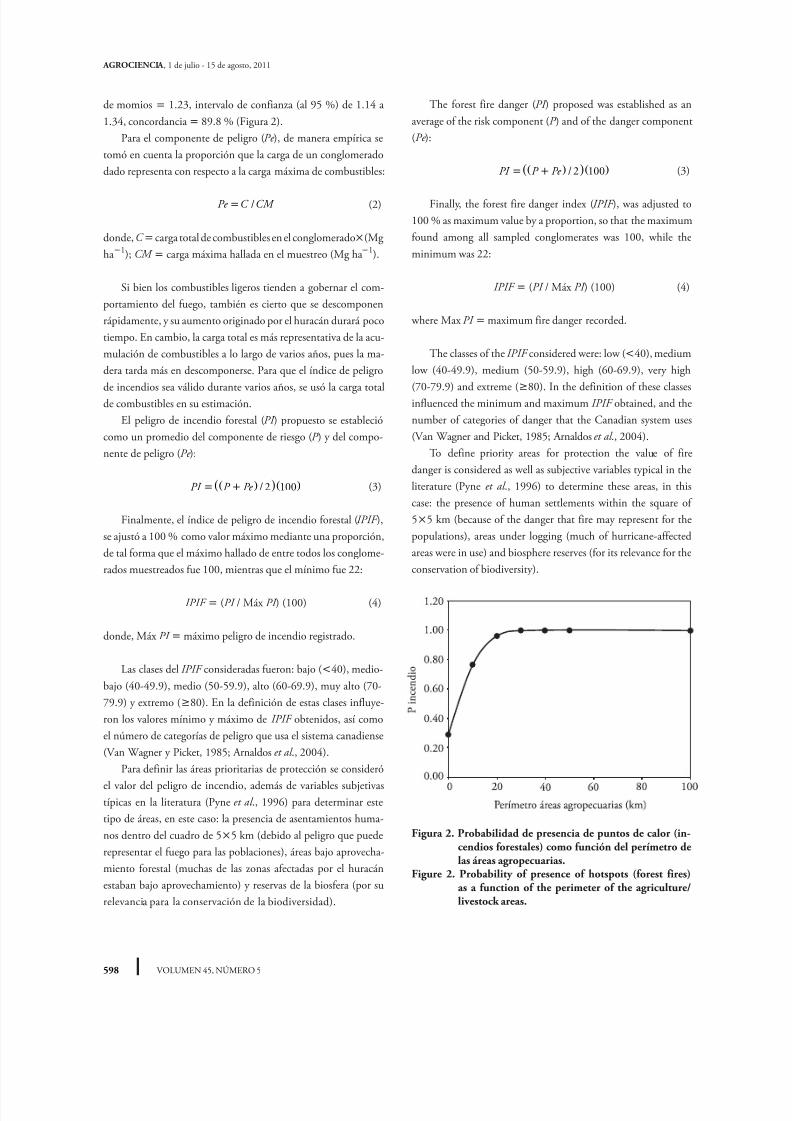
593 RESUMENLas selvas afectadas por huracanes acumulan grandes car- gas de combustibles forestales en corto de tiempo, que jun- to con el mal uso local del fuego y la sensibilidad de los bosques tropicales, las hacen vulnerables a la ocurrencia de incendios catastróficos. En 2007 el Huracán Dean afectó las selvas de Quintana Roo, Campeche y Yucatán. Con el pro- pósito de generar información útil para formular planes de manejo del fuego en la región por las autoridades estatales y fe derales, los objetivos de este estudio fueron estimar las cargas de combustibles forestales generadas por el paso del huracán, modelar el peligro de incendio e identificar áreas prioritarias de protección. Se muestrearon 165 conglome- rados en Quintana Roo, Campeche y Yucatán, en 2007. El peligro de incendio combinó riesgo (perímetro de áreas agropecuarias) y peligro de incendio forestal (carga de com- bustibles). Las estimaciones espaciales se hicieron usando modelos multivariados (kriging), con las que se elaboraron mapas en un sistema de información geográfica (SIG). La moda para cargas fue 40-60 Mg ha1 , la media 40 Mg ha1 y el máximo 137 Mg ha1 . En total 992 000 ha tuvieron pe- ligro muy alto-extremo. Los mayores impactos fueron al este de Quintana Roo y se redujeron hacia el oeste, conforme el huracán perdió fuerza por la fricción con la tierra. Palabras clave: disturbios, fuego, selvas. ABSTRACTForests affected by hurricanes accumulate large forest fuel loads in a short time that along with the local fire misuse and the sensibility of the tropical forests, make them vulnerable to the occurrence of catastrophic wildfires. In 2007, Dean Hurricane affected Quintana Roo, Campeche and Yucatán forests. In order to generate useful information for developing fire management plans in the region by state and federal authorities, the aim of this study was to estimate forest fuel loads generated by the passage of the hurricane, to model the fire danger and identify priority areas for protection. Samples were collected in 165 conglomerates in Quintana Roo, Campeche and Yucatán in 2007. The fire danger combined risk (perimeter of agricultural areas) and forest fire hazard (fuel load). Spatial estimates were made from multivariate models (kriging), with which maps were drawn in a geographic information system (GIS). Mode for loads was 40-60 Mg ha1 , the average 40 Mg ha1 , and the maximum 137 Mg ha1 . A total of 992 000 ha had very high-extreme hazard. The biggest impacts were a t t he eastern part of Quintana Roo, and fell to the western part, as the hurricane lost strength by friction with the earth. Key words: disturbances, fire, tropical forests. INTRODUCTION H istorically, fuels generated by hurricanes increase fire hazards, as it has happened with Hurricane Carmen (1974), Gilberto (1988), Roxanne (1995), Emily and Wilma (2005) (CONAFOR, 2006) [4] . Despite hurricanes are common and the widespread effect that these meteors often cause, their impact has been little studied. MODELAJE DEL PELIGRO DE INCENDIO FORESTAL EN LAS ZONAS AFECTADAS POR EL HURACÁN DEAN MODELING FOREST FIRE DANGER IN THE ZONES AFFECTED BY HURRICANE DEAN Dante A. Rodríguez-Trejo 1* , Hubert Tchikoué 1 , Carlos Cíntora-González1 , Rafael Contreras-Aguado 2 , Alfonso de la Rosa-Vázquez3 1 División de Ciencias Forestales, Universidad Autónoma Chapingo. 56230. Km. 38.5 Carretera México-Texcoco, Chapingo, Estado de México. ([email protected]) (tchikoue@hot mail.com) (c_c_glz@yahoo .com). 2 Consultora Forestal. 77028. Donato Guerra 32. Fraccionamiento Plutarco Elías Calles. Chetumal, Quintana Roo. ([email protected]). 3 Campo Experimental Edzna, INIFAP. 24520. Km. 15.5, Carretera Poc-yaxum, Campeche, Campeche. ([email protected].mx). *Autor responsable vAuthor for correspondence. Recibido: diciembre, 2010. Aprobado: junio, 2011. Publicado como ARTÍCULO en Agrociencia 45: 593-608. 2011 .
Las selvas afectadas por huracanes acumulan grandes car-
gas de combustibles forestales en corto de tiempo que jun-to con el mal uso local del fuego y la sensibilidad de los
bosques tropicales las hacen vulnerables a la ocurrencia de
incendios catastroacuteficos En 2007 el Huracaacuten Dean afectoacute las
selvas de Quintana Roo Campeche y Yucataacuten Con el pro-
poacutesito de generar informacioacuten uacutetil para formular planes de
manejo del fuego en la regioacuten por las autoridades estatales
y federales los objetivos de este estudio fueron estimar las
cargas de combustibles forestales generadas por el paso del
huracaacuten modelar el peligro de incendio e identificar aacutereas
prioritarias de proteccioacuten Se muestrearon 165 conglome-
rados en Quintana Roo Campeche y Yucataacuten en 2007 El
peligro de incendio combinoacute riesgo (periacutemetro de aacutereasagropecuarias) y peligro de incendio forestal (carga de com-
bustibles) Las estimaciones espaciales se hicieron usando
modelos multivariados (kriging) con las que se elaboraron
mapas en un sistema de informacioacuten geograacutefica (SIG) La
moda para cargas fue 40-60 Mg ha 1 la media 40 Mg ha 1
y el maacuteximo 137 Mg ha 1 En total 992 000 ha tuvieron pe-
ligro muy alto-extremo Los mayores impactos fueron al este
de Quintana Roo y se redujeron hacia el oeste conforme el
huracaacuten perdioacute fuerza por la friccioacuten con la tierra
Palabras clave disturbios fuego selvas
A BSTRACT
Forests affected by hurricanes accumulate large forest fuel
loads in a short time that along with the local fire misuseand the sensibility of the tropical forests make them
vulnerable to the occurrence of catastrophic wildfires In
2007 Dean Hurricane affected Quintana Roo Campeche
and Yucataacuten forests In order to generate useful information
for developing fire management plans in the region by state
and federal authorities the aim of this study was to estimate
forest fuel loads generated by the passage of the hurricane
to model the fire danger and identify priority areas for
protection Samples were collected in 165 conglomerates
in Quintana Roo Campeche and Yucataacuten in 2007 The fire
danger combined risk (perimeter of agricultural areas) and
forest fire hazard (fuel load) Spatial estimates were madefrom multivariate models (kriging) with which maps were
drawn in a geographic information system (GIS) Mode for
loads was 40-60 Mg ha 1 the average 40 Mg ha 1 and
the maximum 137 Mg ha 1 A total of 992 000 ha had
very high-extreme hazard The biggest impacts were at the
eastern part of Quintana Roo and fell to the western part
as the hurricane lost strength by friction with the earth
Key words disturbances fire tropical forests
INTRODUCTION
Historically fuels generated by hurricanesincrease fire hazards as it has happened
with Hurricane Carmen (1974) Gilberto(1988) Roxanne (1995) Emily and Wilma (2005)(CONAFOR 2006)[4] Despite hurricanes arecommon and the widespread effect that these meteorsoften cause their impact has been little studied
MODELAJE DEL PELIGRO DE INCENDIO FORESTALEN LAS ZONAS AFECTADAS POR EL HURACAacuteN DEAN
MODELING FOREST FIRE DANGER IN THE ZONES AFFECTED BY HURRICANE DEAN
Dante A Rodriacuteguez-Trejo1 Hubert Tchikoueacute1 Carlos Ciacutentora-Gonzaacutelez 1Rafael Contreras-Aguado2 Alfonso de la Rosa-Vaacutezquez 3
1Divisioacuten de Ciencias Forestales Universidad Autoacutenoma Chapingo 56230 Km 385Carretera Meacutexico-Texcoco Chapingo Estado de Meacutexico (dantearturoyahoocom)(tchikouehotmailcom) (c_c_glzyahoocom) 2Consultora Forestal 77028 Donato Guerra32 Fraccionamiento Plutarco Eliacuteas Calles Chetumal Quintana Roo (rcontreagyahoocom)3Campo Experimental Edzna INIFAP 24520 Km 155 Carretera Poc-yaxum CampecheCampeche (delarosaalfonsoinifapgobmx)
Autor responsable v Author for correspondenceRecibido diciembre 2010 Aprobado junio 2011Publicado como ARTIacuteCULO en Agrociencia 45 593-608 2011
Histoacutericamente los combustibles generadospor huracanes aumentan el peligro de in-cendio como ha sucedido con los huraca-
nes Carmen (en 1974) Gilberto (en 1988) Roxanne(en 1995) Emily y Wilma (en 2005) (CONAFOR2006)[4] A pesar de ser comunes y del extenso efectoque con frecuencia originan estos meteoros su im-pacto ha sido poco estudiado La interaccioacuten entre huracanes e incendios fores-tales en los bosques tropicales ocurre desde hace mi-llones de antildeos (Loacutepez et al 1990 Myers y van Lear1998) Si se agrega el efecto de factores antroacutepicoscomo el cambio de uso del suelo y el mal uso del fue-go resulta deforestacioacuten y fragmentacioacuten en los bos-ques tropicales sensibles al fuego Asiacute Rodriacuteguez et
al (2008) anotan que la superficie de aacutereas perturba-das o el apoyo financiero al productor agropecuarioentre otros factores se correlacionan con la superficieafectada por incendios en Meacutexico El 21 de agosto de 2007 el huracaacuten Dean arri-boacute a la costa de Quintana Roo y se dirigioacute al oestecon una velocidad de 260 km h1 y rachas de hasta315 km h1 El meteoro damnificoacute a la poblacioacutenincrementoacute el peligro de incendio afectoacute las exis-tencias maderables los avances en ordenamiento ymanejo forestal proyectos ecoturiacutesticos plantacionescomerciales infraestructura de caminos y aserrade-
ros (CONAFOR-SEMARNAT 2007)[5]
Las selvasresguardan gran parte de la biodiversidad mundialy de Meacutexico (Challenger y Soberoacuten 2008) pero elpaso del huracaacuten el peligro de incendio derivado delmismo y la sensibilidad de estos ecosistemas al fuegoamenazan tal biodiversidad El peligro de incendio forestal es resultado de fac-tores constantes y variables que afectan el inicio lapropagacioacuten y la dificultad de su control Entre talesfactores destacan topografiacutea carga de combustiblesy tiempo atmosfeacuterico (Chandler et al 1983) La to-pografiacutea es sensiblemente plana en Quintana Roo
por lo que se consideroacute que su efecto es relativamenteuniforme y no se tomoacute en cuenta El huracaacuten Deanprodujo distintas acumulaciones de combustibles
Hurricane-fire interactions in tropical forestsoccur over millions of years (Loacutepez et al 1990Myers and van Lear 1998) By adding the effectof anthropical factors such as changing land useand misuse of fire this results in deforestation andfragmentation in fire-sensitive tropical forests ThusRodriacuteguez et al (2008) point out that the surface ofdisturbed areas or financial support to agriculturalproducers among other factors are correlated withthe surface affected by fires in Meacutexico On August 21 2007 Hurricane Dean reachedthe coast of Quintana Roo and headed west
with a speed of 260 km h1 and wind gusts ofup to 315 km h1 The hurricane affected thepopulation increased fire hazard affected timberstocks advances in forest management ecotourismprojects commercial plantations infrastructure of
roads and sawmills (CONAFOR-SEMARNAT2007)[5] Forests shelter a large part of global andMeacutexico biodiversity (Challenger and Soberoacuten2008) but the passage of hurricane the firehazard derived from it and the sensitivity of theseecosystems to fire threat such biodiversity
The forest fire danger is result of constant andvariable factors affecting the start propagationand difficult to control it Such factors includetopography fuel load and weather (Chandleret al 1983) Topography is substantially flat inQuintana Roo so it is considered that its effect
is relatively uniform and was not taken intoaccount Hurricane Dean caused various forestfuel accumulations throughout the affected areaand its load itself was considered Many indicesuse meteorological variables but others do not(Pyne et al 1996) In the present study thesevariables were not included The variables relatedto agricultural activities (43 of fire causes inMeacutexico) were included To estimate the forest fire danger the risk factorschosen in one or more numerical or qualitativeindices related to the need for protection are
integrated (Chandler et al 1983) Research onestimation of fire hazard in tropical areas affected byhurricanes is very scarce In the Amazons Maeda et
4 CONAFOR (Comisioacuten Nacional Forestal) 2006 Evaluacioacuten del riesgo de incendios forestales por el huracaacuten ldquoWilmardquo 2005 QuintanaRoo CONAFOR Reporte teacutecnico (ineacutedito)5 CONAFOR-SEMARNAT 2007 Programa emergente para la prevencioacuten y combate de incendios forestales zona centro-sur del estadode Quintana Roo Reporte teacutecnico (ineacutedito)
MODELAJE DEL PELIGRO DE INCENDIO FORESTAL EN LAS ZONAS AFECTADAS POR EL HURACAacuteN DEAN
595RODRIacuteGUEZ-TREJO et al
forestales a lo largo y ancho del aacuterea afectada y sucarga siacute fue contemplada Muchos iacutendices empleanvariables meteoroloacutegicas pero otros no (Pyne et al 1996) En el presente estudio no se incluyeron dichasvariables pero siacute las relativas a actividades agropecua-rias (43 de las causas de incendio en Meacutexico) Para estimar el peligro de incendio forestal se in-tegra los factores de peligro elegidos en uno o maacutesiacutendices numeacutericos o cualitativos relacionados con lanecesidad de proteccioacuten (Chandler et al 1983) Lainvestigacioacuten sobre estimacioacuten de peligro de incendioen aacutereas tropicales afectadas por huracanes es muy es-casa En el Amazonas Maeda et al (2011) utilizaronanaacutelisis vectorial para estimar el riesgo de incendioforestal con las variables aacutereas agriacutecolas y bosque condiferentes niveles de perturbacioacuten o con variables deuso del suelo y su dinaacutemica de cambio empleando
redes neuronales artificiales (Maeda et al 2009)Para estimar el peligro de incendio en aacutereas templa-das de la Sierra Madre Oriental Meacutexico Muntildeoz etal (2005) integraron variables de carga de combus-tibles forestales meteoroloacutegicas y antroacutepicas usandoanaacutelisis espacial multicriterio En zonas templadas deNueva Inglaterra (EEUU) la elevada carga de com-bustibles acumulada tras el paso de huracanes es elprincipal factor que incrementa el peligro de incen-dio (Uriarte y Papaik 2007) Por lo anterior los objetivos del presente estudiofueron 1) determinar la disposicioacuten espacial y patro-
nes de distribucioacuten de cargas de combustibles foresta-les producto del Huracaacuten Dean 2) evaluar el peligrode incendio y 3) determinar aacutereas de proteccioacuten prio-ritaria y elaborar la cartografiacutea respectiva La hipoacutetesisfue que el peligro de incendio forestal aumenta con lacarga de combustibles forestales y con el nuacutemero deaacutereas agriacutecolas o su superficie o su periacutemetro asiacute comocon la densidad o la longitud de caminos
M ATERIALES Y MEacuteTODOS
Aacuterea de estudio y muestreo de combustibles
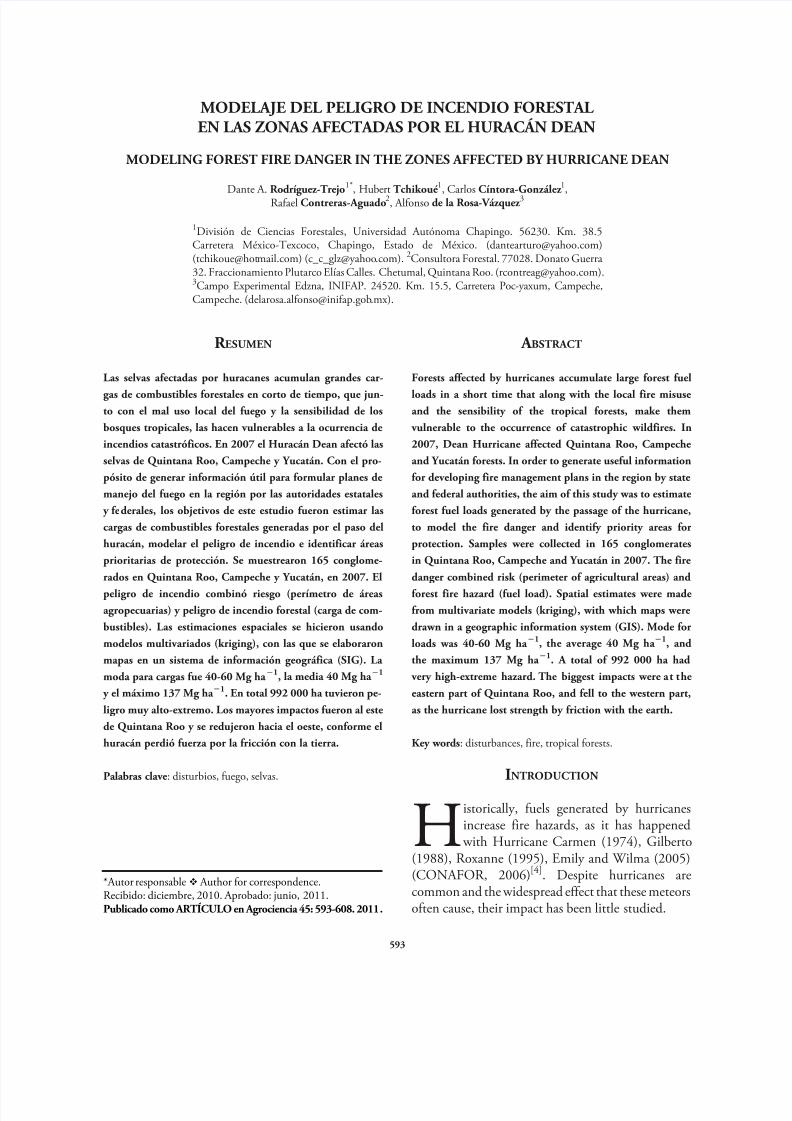
El aacuterea de trabajo incluyoacute el centro y sur de Quintana Roo el
este de Campeche y el sur de Yucataacuten (Figura 1) y el muestreo se
hizo al azar por conglomerados en el 2007 Cada conglomerado
estuvo compuesto por tres liacuteneas principales para muestreo de
combustibles lentildeosos seguacuten Brown (1974) orientadas a 0 120
y 240deg de azimut y dos cuadros de 0303 m para hojarasca y
capa de fermentacioacuten (Flores et al 2008)
al (2011) used vector analysis to estimate the forestfire hazard with the agricultural and forest areavariables at different levels of disturbance or land usevariables and its dynamics of change using artificialneuronal networks (Maeda et al 2009) To estimatethe fire hazard in temperate areas of the Sierra MadreOriental Meacutexico Muntildeoz et al (2005) integratedvariables of forest fuel load meteorological andanthropical using multi-criteria spatial analysis Intemperate areas of New England (USA) the highestfuel load accumulated after the passage of hurricanesis the main factor increasing the fire hazard (Uriarteand Papaik 2007) Therefore the objectives of this study were1) to determine the spatial arrangement andpatterns of distribution of forest fuel loads result ofHurricane Dean 2) evaluate the danger of fire and
3) determine priority protection areas and developthe respective mapping The hypothesis was thatthe forest fire danger increases with forest fuelloads and the number of agricultural areas or theirsurface or their perimeter as well as the density orlength of roads
M ATERIALS AND METHODS
Study area and fuel sampling
The study area included the central and southern part of
the state of Quintana Roo eastern Campeche and southern Yucataacuten (Figure 1) and sampling was carried out at random by
conglomerates in 2007 Each conglomerate consisted of three
main lines for sampling of woody fuels according to Brown
(1974) oriented at 0 120 and 240deg azimuth and two squares
of 0303 m for litter and fermentation layer (Flores et al
2008)
The sampling lines were 14 m long and divided into four
segments to measure different types of fuel according to the
timelag classes (TL) of woody fuels 35 m (TL1 h and
TL10 h) 7 m (TL100 h) and 14 m (TL1000 h) Samples
of litter and fermentation layer were collected dried in the
laboratory and their load was calculated Samples were collectedin 165 conglomerates 330 sites for litter and fermentation
layer and 1980 lines for woody fuel The sampling intensity
corresponded to a line for sampling of woody fuels per each
2803 ha The center of each conglomerate was geo-referenced
with a geopositioner (GPS) The sample was distributed over
1 400 000 ha obtaining 81 33 and 41 conglomerates in
areas of high medium and low affected areas plus 10 next to
Carga total de combustibles forestales Nuacutemero de aacutereas agriacutecolas o pecuarias por cuadro de 55 km Aacuterea de aacutereas agriacutecolas o pecuarias por cuadro de 55 km
Periacutemetro de aacutereas agriacutecolas o pecuarias por cuadro de 55 kmDensidad de caminos (nuacutemero de ramales ha 1) por cuadro de 55 km
Longitud de caminos (kmha) por cuadro de 55 km
6 CONAFOR (Comisioacuten Nacional Forestal) 2009 Reporte de incendios forestales CONAFOR Folleto
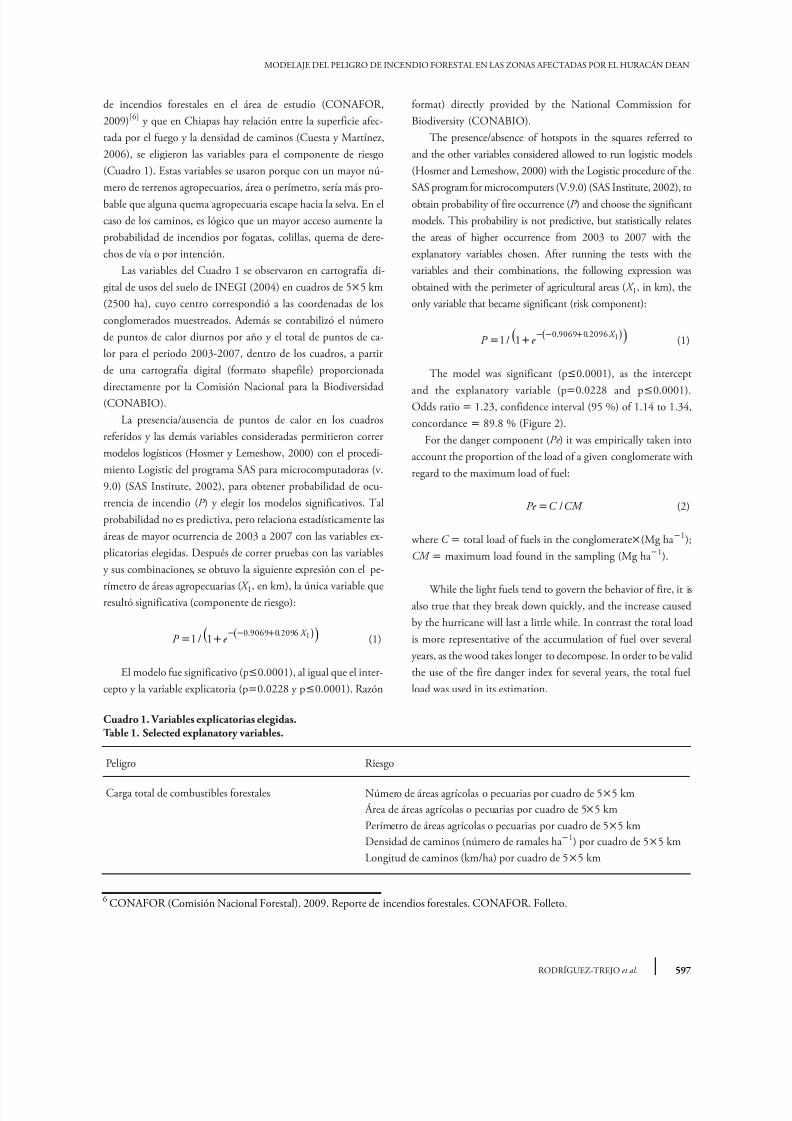
este caso las estimaciones fueron θ0 435 2= θ1 989 5= α=8 2506 y pseudo-R 2 094 El efecto de tendencia en las
coordenadas fue no significativo α=( )0 84 y debido a esto
tambieacuten se utilizoacute un krigado ordinario para predecir esta va-
riable respuesta El error estaacutendar residual obtenido de la esti-
macioacuten fue 304 unidades de carga total Aunque en ocasiones se realizan particiones del conjunto
de observaciones y con base en eacutestas se hacen predicciones
que permiten la validacioacuten cruzada auacuten hay controversia de
la validez de tales teacutecnicas bajo algunas estructuras de auto-
correlacioacuten (Cressie 1993) Asiacute en este caso se consideraron
criterios suficientes la optimalidad predictiva del krigado y
el ajuste satisfactorio de los semi-varigramas muestrales Las
Figuras 3 y 4 muestran los semi-variogramas estimados
Las estimaciones requeridas se efectuaron usando funciones
escritas por el usuario en el programa S-Plus y usando el moacutedulo
Spatial Statistics V 15 (Insightful Corporation 2002) La sis-
tematizacioacuten de datos de los sitios de muestreo se realizoacute con elSIG Arc View (v 32 Environmental Systems Research Institute
1999) para obtener mapas
R ESULTADOS Y DISCUSIOacuteN
La superficie afectada a distintas intensidades fue1 278 589 ha (alta intensidad) 986 979 ha (media)y 2 788 971 ha (baja) 5 054 539 ha en total La sel-va mediana subperennifolia tuvo 840 620 ha de altaafectacioacuten por su amplia extensioacuten donde el huracaacutencausoacute los mayores impactos en la regioacuten este de la
Peniacutensula de Yucataacuten
case the estimates were θ0 435 2= θ1 989 5= α=8 2506
and pseudo-R 2 094 The effect of trend in the coordinates
was not significant α=( )0 84 and because of this it was also
used an ordinary kriging to predict this response variable The
residual standard error obtained from the estimation was 304
units of total load Although sometimes partitions of the set of observations are
carried out and based on these partitions predictions are made
that allow cross-validation there is still controversy as to the
validity of such techniques in some structures of autocorrelation
(Cressie 1993) So in this case sufficient criteria were considered
the predictive optimality of kriging and the satisfactory
adjustment of the sample semi-variogramas Figures 3 and 4
show the estimated semi-variograms
The required estimations were done using functions written
by the user in the program S-Plus and using the module
Spatial Statistics V 15 (Insightful Corporation 2002) Data
systematization of the sampled sites was performed with the SIG Arc View (v 32 Environmental Systems Research Institute
1999) to obtain maps
R ESULTS AND DISCUSSION
The area affected at different intensities was1 278 589 ha (high intensity) 986 979 ha (mediumintensity) and 2 788 971 ha (low intensity)5 054 539 ha in total The medium semi-evergreentropical forest had 840 620 ha of high damage for its
wide extension where the hurricane cause the greatest
impact in the eastern region of the Yucataacuten peninsula
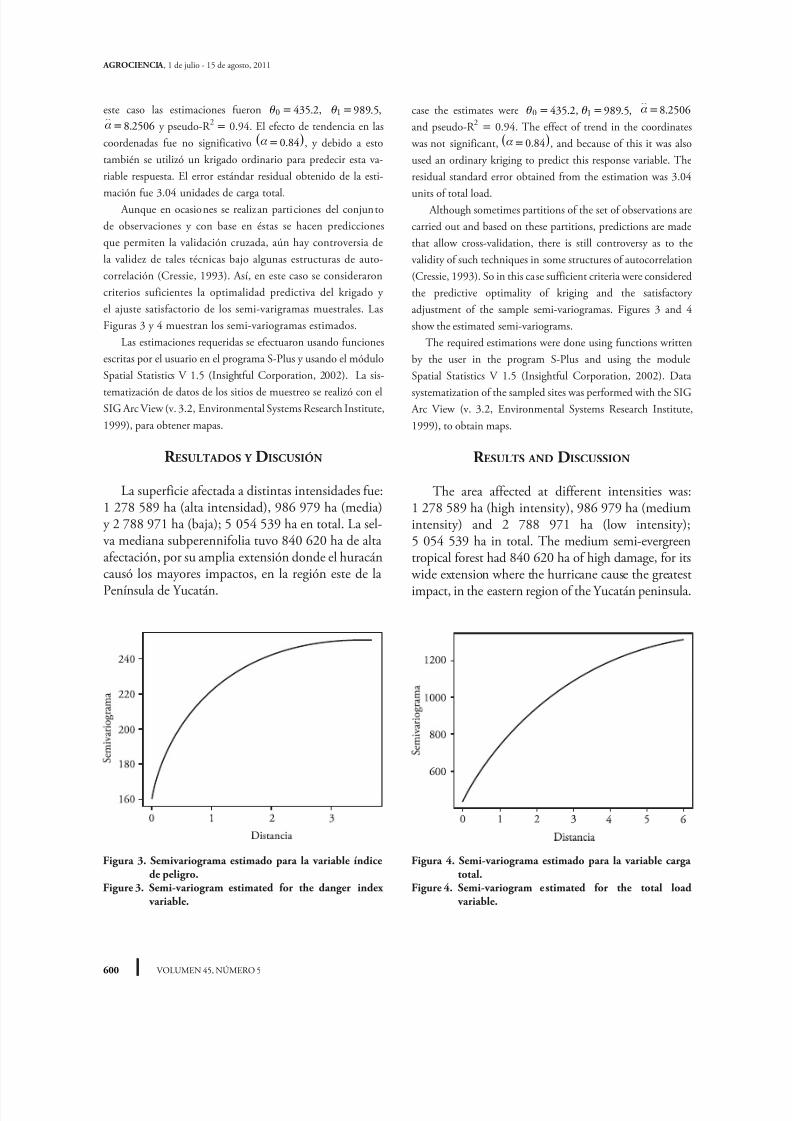
Figura 4 Semi-variograma estimado para la variable cargatotal
Figure 4 Semi-variogram estimated for the total load variable
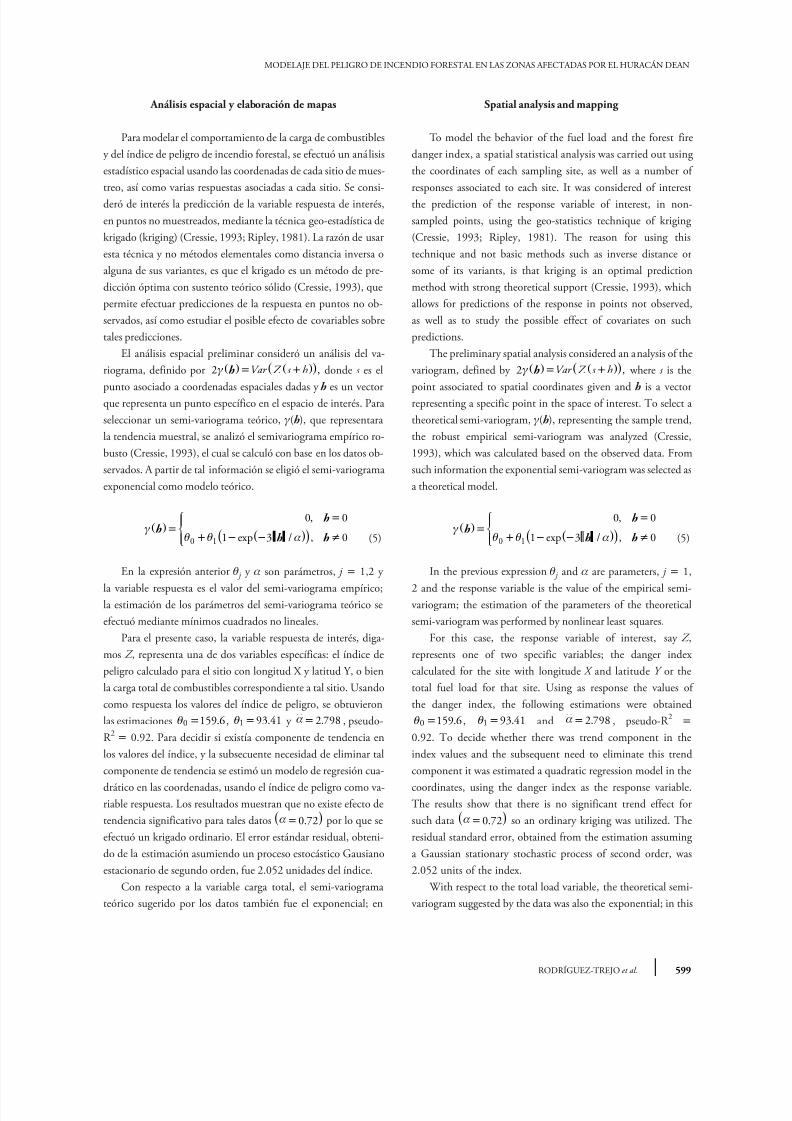
Figura 3 Semivariograma estimado para la variable iacutendicede peligro
Figure 3 Semi-variogram estimated for the danger index variable
MODELAJE DEL PELIGRO DE INCENDIO FORESTAL EN LAS ZONAS AFECTADAS POR EL HURACAacuteN DEAN
601RODRIacuteGUEZ-TREJO et al
Carga de combustibles forestales
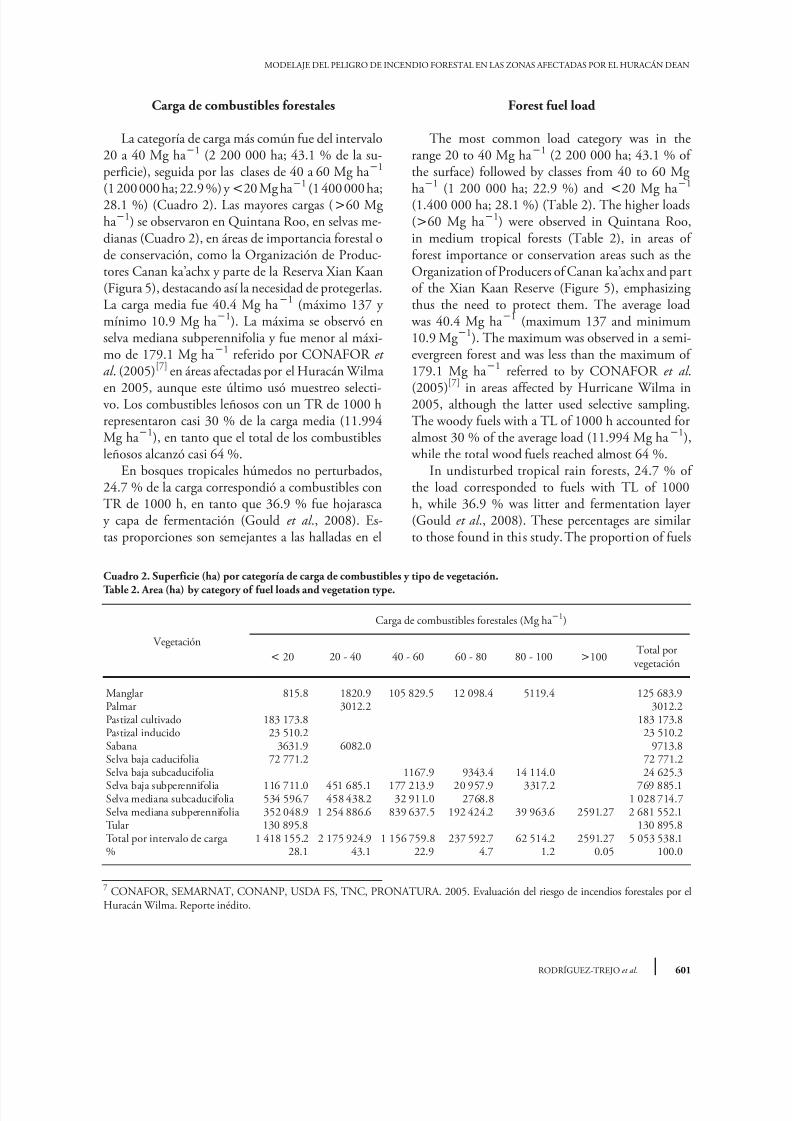
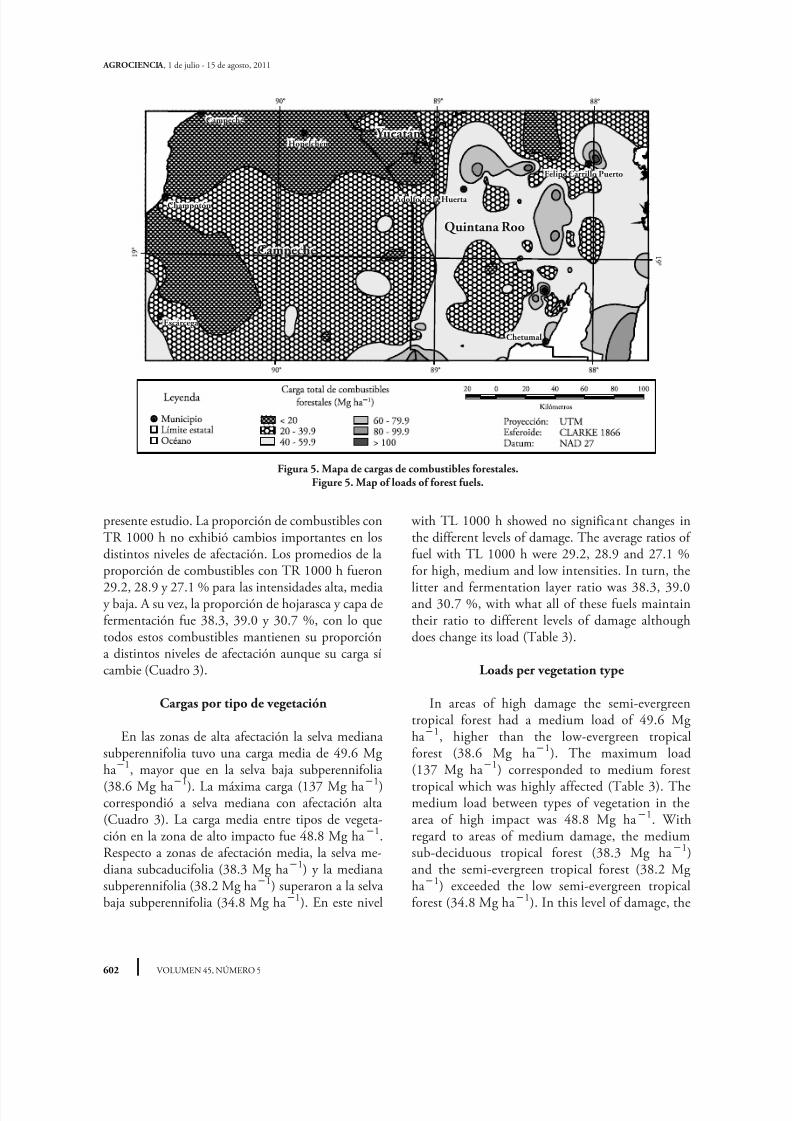
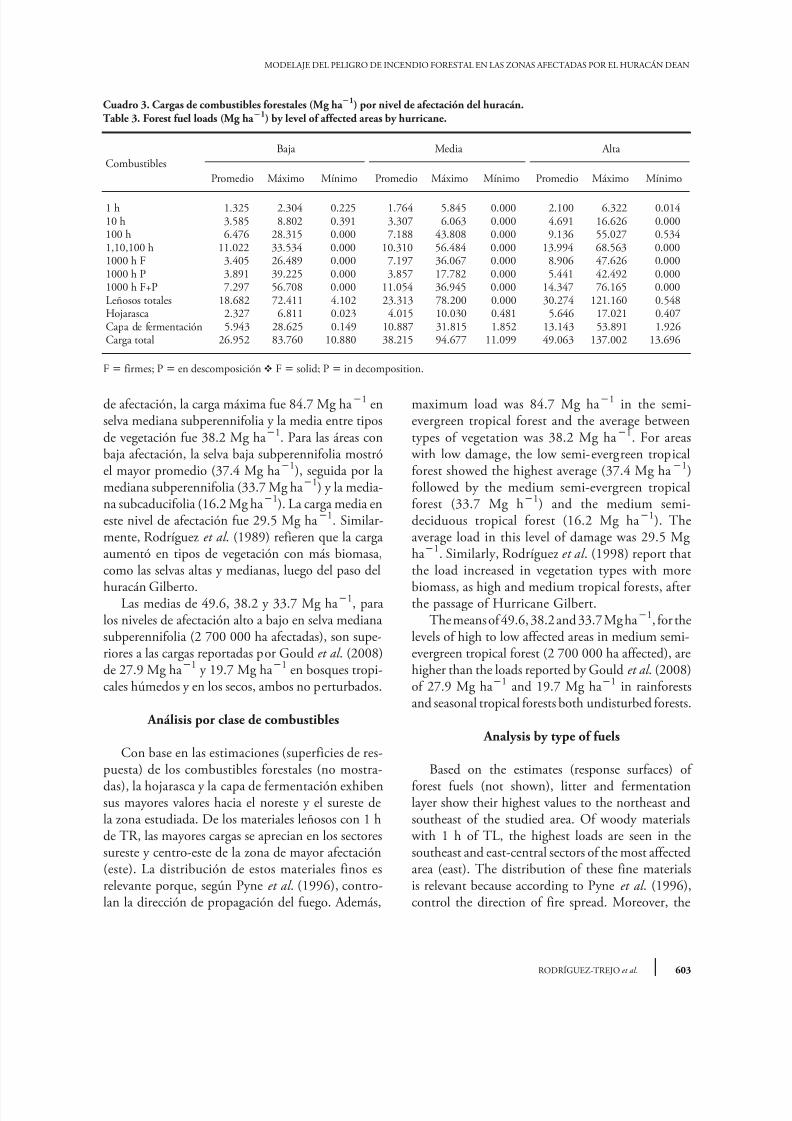
La categoriacutea de carga maacutes comuacuten fue del intervalo20 a 40 Mg ha 1 (2 200 000 ha 431 de la su-perficie) seguida por las clases de 40 a 60 Mg ha 1 (1 200 000 ha 229 ) y20 Mg ha 1 (1 400 000 ha281 ) (Cuadro 2) Las mayores cargas (60 Mgha 1) se observaron en Quintana Roo en selvas me-dianas (Cuadro 2) en aacutereas de importancia forestal ode conservacioacuten como la Organizacioacuten de Produc-tores Canan karsquoachx y parte de la Reserva Xian Kaan(Figura 5) destacando asiacute la necesidad de protegerlasLa carga media fue 404 Mg ha 1 (maacuteximo 137 ymiacutenimo 109 Mg ha 1) La maacutexima se observoacute enselva mediana subperennifolia y fue menor al maacutexi-mo de 1791 Mg ha 1 referido por CONAFOR etal (2005)[7] en aacutereas afectadas por el Huracaacuten Wilma
en 2005 aunque este uacuteltimo usoacute muestreo selecti-vo Los combustibles lentildeosos con un TR de 1000 hrepresentaron casi 30 de la carga media (11994Mg ha 1) en tanto que el total de los combustibleslentildeosos alcanzoacute casi 64
En bosques tropicales huacutemedos no perturbados247 de la carga correspondioacute a combustibles conTR de 1000 h en tanto que 369 fue hojarascay capa de fermentacioacuten (Gould et al 2008) Es-tas proporciones son semejantes a las halladas en el
Forest fuel load
The most common load category was in therange 20 to 40 Mg ha 1 (2 200 000 ha 431 ofthe surface) followed by classes from 40 to 60 Mgha 1 (1 200 000 ha 229 ) and 20 Mg ha 1 (1400 000 ha 281 ) (Table 2) The higher loads(60 Mg ha 1) were observed in Quintana Rooin medium tropical forests (Table 2) in areas offorest importance or conservation areas such as theOrganization of Producers of Canan karsquoachx and partof the Xian Kaan Reserve (Figure 5) emphasizingthus the need to protect them The average load
was 404 Mg ha 1 (maximum 137 and minimum109 Mg 1) The maximum was observed in a semi-evergreen forest and was less than the maximum of1791 Mg ha 1 referred to by CONAFOR et al
(2005)[7]
in areas affected by Hurricane Wilma in2005 although the latter used selective samplingThe woody fuels with a TL of 1000 h accounted foralmost 30 of the average load (11994 Mg ha 1)
while the total wood fuels reached almost 64 In undisturbed tropical rain forests 247 ofthe load corresponded to fuels with TL of 1000h while 369 was litter and fermentation layer(Gould et al 2008) These percentages are similarto those found in this study The proportion of fuels
Cuadro 2 Superficie (ha) por categoriacutea de carga de combustibles y tipo de vegetacioacuten
Table 2 Area (ha) by category of fuel loads and vegetation type
presente estudio La proporcioacuten de combustibles conTR 1000 h no exhibioacute cambios importantes en losdistintos niveles de afectacioacuten Los promedios de laproporcioacuten de combustibles con TR 1000 h fueron
292 289 y 271 para las intensidades alta mediay baja A su vez la proporcioacuten de hojarasca y capa defermentacioacuten fue 383 390 y 307 con lo quetodos estos combustibles mantienen su proporcioacutena distintos niveles de afectacioacuten aunque su carga siacutecambie (Cuadro 3)
Cargas por tipo de vegetacioacuten
En las zonas de alta afectacioacuten la selva medianasubperennifolia tuvo una carga media de 496 Mgha 1 mayor que en la selva baja subperennifolia
(386 Mg ha 1) La maacutexima carga (137 Mg ha 1)correspondioacute a selva mediana con afectacioacuten alta(Cuadro 3) La carga media entre tipos de vegeta-cioacuten en la zona de alto impacto fue 488 Mg ha 1Respecto a zonas de afectacioacuten media la selva me-diana subcaducifolia (383 Mg ha 1) y la medianasubperennifolia (382 Mg ha 1) superaron a la selvabaja subperennifolia (348 Mg ha 1) En este nivel
with TL 1000 h showed no significant changes inthe different levels of damage The average ratios offuel with TL 1000 h were 292 289 and 271 for high medium and low intensities In turn the
litter and fermentation layer ratio was 383 390and 307 with what all of these fuels maintaintheir ratio to different levels of damage althoughdoes change its load (Table 3)
Loads per vegetation type
In areas of high damage the semi-evergreentropical forest had a medium load of 496 Mgha 1 higher than the low-evergreen tropicalforest (386 Mg ha 1) The maximum load(137 Mg ha 1) corresponded to medium forest
tropical which was highly affected (Table 3) Themedium load between types of vegetation in thearea of high impact was 488 Mg ha 1 Withregard to areas of medium damage the mediumsub-deciduous tropical forest (383 Mg ha 1)and the semi-evergreen tropical forest (382 Mgha 1) exceeded the low semi-evergreen tropicalforest (348 Mg ha 1) In this level of damage the
Figura 5 Mapa de cargas de combustibles forestalesFigure 5 Map of loads of forest fuels
MODELAJE DEL PELIGRO DE INCENDIO FORESTAL EN LAS ZONAS AFECTADAS POR EL HURACAacuteN DEAN
603RODRIacuteGUEZ-TREJO et al
maximum load was 847 Mg ha 1 in the semi-evergreen tropical forest and the average betweentypes of vegetation was 382 Mg ha 1 For areas
with low damage the low semi-evergreen tropicalforest showed the highest average (374 Mg ha 1)followed by the medium semi-evergreen tropicalforest (337 Mg h1) and the medium semi-deciduous tropical forest (162 Mg ha 1) Theaverage load in this level of damage was 295 Mgha 1 Similarly Rodriacuteguez et al (1998) report thatthe load increased in vegetation types with more
biomass as high and medium tropical forests afterthe passage of Hurricane Gilbert The means of 496 382 and 337 Mg ha 1 for thelevels of high to low affected areas in medium semi-evergreen tropical forest (2 700 000 ha affected) arehigher than the loads reported by Gould et al (2008)of 279 Mg ha 1 and 197 Mg ha 1 in rainforestsand seasonal tropical forests both undisturbed forests
Analysis by type of fuels
Based on the estimates (response surfaces) of
forest fuels (not shown) litter and fermentationlayer show their highest values to the northeast andsoutheast of the studied area Of woody materials
with 1 h of TL the highest loads are seen in thesoutheast and east-central sectors of the most affectedarea (east) The distribution of these fine materialsis relevant because according to Pyne et al (1996)control the direction of fire spread Moreover the
Cuadro 3 Cargas de combustibles forestales (Mg ha 1) por nivel de afectacioacuten del huracaacutenTable 3 Forest fuel loads (Mg ha 1) by level of affected areas by hurricane
F firmes P en descomposicioacutenv F solid P in decomposition
de afectacioacuten la carga maacutexima fue 847 Mg ha 1 enselva mediana subperennifolia y la media entre tiposde vegetacioacuten fue 382 Mg ha 1 Para las aacutereas conbaja afectacioacuten la selva baja subperennifolia mostroacuteel mayor promedio (374 Mg ha 1) seguida por lamediana subperennifolia (337 Mg ha 1) y la media-na subcaducifolia (162 Mg ha 1) La carga media eneste nivel de afectacioacuten fue 295 Mg ha 1 Similar-mente Rodriacuteguez et al (1989) refieren que la cargaaumentoacute en tipos de vegetacioacuten con maacutes biomasacomo las selvas altas y medianas luego del paso del
huracaacuten Gilberto Las medias de 496 382 y 337 Mg ha 1 paralos niveles de afectacioacuten alto a bajo en selva medianasubperennifolia (2 700 000 ha afectadas) son supe-riores a las cargas reportadas por Gould et al (2008)de 279 Mg ha 1 y 197 Mg ha 1 en bosques tropi-cales huacutemedos y en los secos ambos no perturbados
Anaacutelisis por clase de combustibles
Con base en las estimaciones (superficies de res-puesta) de los combustibles forestales (no mostra-
das) la hojarasca y la capa de fermentacioacuten exhibensus mayores valores hacia el noreste y el sureste dela zona estudiada De los materiales lentildeosos con 1 hde TR las mayores cargas se aprecian en los sectoressureste y centro-este de la zona de mayor afectacioacuten(este) La distribucioacuten de estos materiales finos esrelevante porque seguacuten Pyne et al (1996) contro-lan la direccioacuten de propagacioacuten del fuego Ademaacutes
el patroacuten y caracteriacutesticas de combustibles como ho- jarasca y capa de fermentacioacuten influyen en la pro-babilidad de incendios subterraacuteneos los que emitenmaacutes partiacuteculas suspendidas a la atmoacutesfera (Cochraney Ryan 2009) La capa de fermentacioacuten tarda maacutesque la hojarasca en iniciar su combustioacuten pero libe-ra maacutes energiacutea y hace maacutes severos los incendios sub-terraacuteneos comparados con los superficiales (Neri etal 2008) Los incendios subterraacuteneos son difiacutecilesde combatir y con frecuencia imparables Los com-bustibles con 10 h de TR tuvieron una tendenciasimilar a los de 1 h de TR La mayor concentracioacutende combustibles con 100 h de TR estaacute en la porcioacutenNE y en la centro-este En anaacutelisis combinado decombustibles de 1-100 h de TR la tendencia de losde 100 h prevalece Hay cargas altas de combustibles lentildeosos con TR
de 1000 h desde la costa hasta los liacutemites de Yucataacuteny Campeche por la peacuterdida de fuerza del huracaacutenCon materiales maacutes pesados como estos uacuteltimos elfuego adquiere mayor intensidad lo que dificulta elcontrol (Pyne et al 1996) ademaacutes cuentan con ma-yor tiempo de residencia Finalmente la carga totalmuestra una tendencia semejante a la anterior Paratodos los combustibles lentildeosos hay picos intercala-dos entre partes maacutes o menos planas u onduladasEste comportamiento y la relativa escasez de com-bustibles con TR de 1 y 10 h al NE y una relativa-mente menor presencia de combustibles con TR de
100 h al SE obedecen a distintos efectos del huracaacutenen regiones con diferentes tipos y proporciones deselvas y usos de suelo
Peligro de incendio forestal
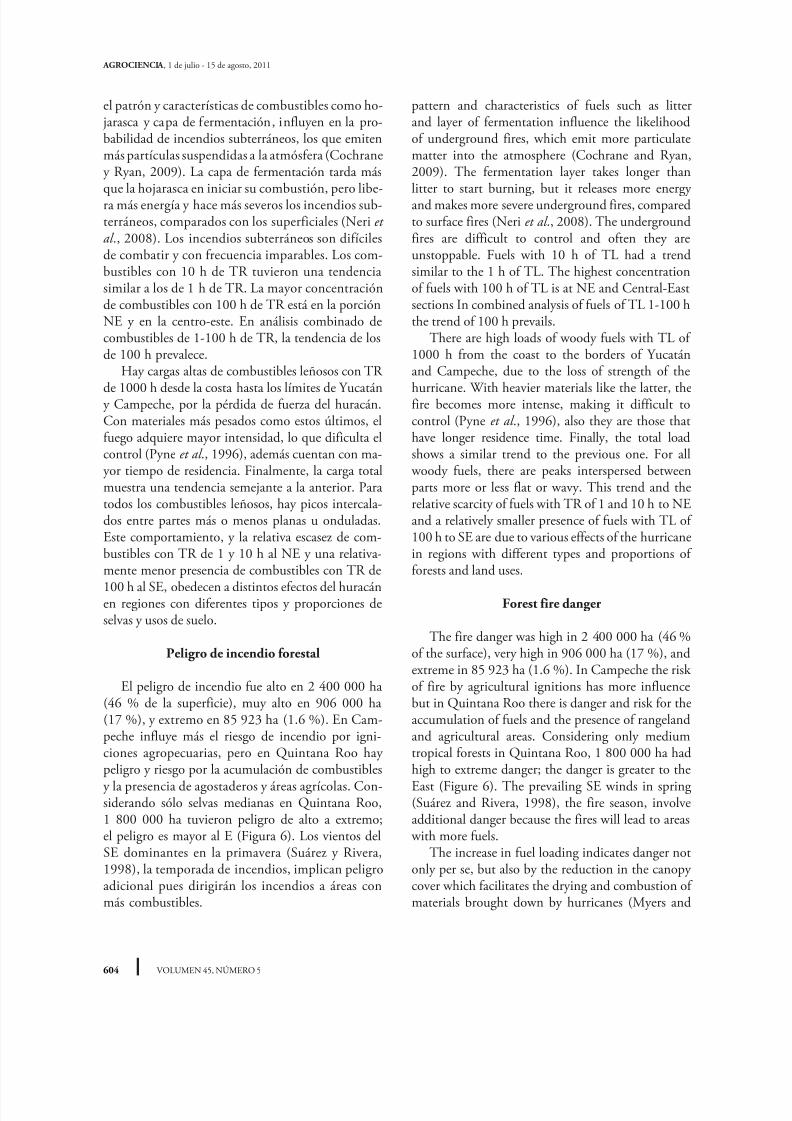
El peligro de incendio fue alto en 2 400 000 ha(46 de la superficie) muy alto en 906 000 ha(17 ) y extremo en 85 923 ha (16 ) En Cam-peche influye maacutes el riesgo de incendio por igni-ciones agropecuarias pero en Quintana Roo haypeligro y riesgo por la acumulacioacuten de combustibles
y la presencia de agostaderos y aacutereas agriacutecolas Con-siderando soacutelo selvas medianas en Quintana Roo1 800 000 ha tuvieron peligro de alto a extremoel peligro es mayor al E (Figura 6) Los vientos delSE dominantes en la primavera (Suaacuterez y Rivera1998) la temporada de incendios implican peligroadicional pues dirigiraacuten los incendios a aacutereas conmaacutes combustibles
pattern and characteristics of fuels such as litterand layer of fermentation influence the likelihoodof underground fires which emit more particulatematter into the atmosphere (Cochrane and Ryan2009) The fermentation layer takes longer thanlitter to start burning but it releases more energyand makes more severe underground fires comparedto surface fires (Neri et al 2008) The undergroundfires are difficult to control and often they areunstoppable Fuels with 10 h of TL had a trendsimilar to the 1 h of TL The highest concentrationof fuels with 100 h of TL is at NE and Central-Eastsections In combined analysis of fuels of TL 1-100 hthe trend of 100 h prevails
There are high loads of woody fuels with TL of1000 h from the coast to the borders of Yucataacutenand Campeche due to the loss of strength of the
hurricane With heavier materials like the latter thefire becomes more intense making it difficult tocontrol (Pyne et al 1996) also they are those thathave longer residence time Finally the total loadshows a similar trend to the previous one For all
woody fuels there are peaks interspersed betweenparts more or less flat or wavy This trend and therelative scarcity of fuels with TR of 1 and 10 h to NEand a relatively smaller presence of fuels with TL of100 h to SE are due to various effects of the hurricanein regions with different types and proportions offorests and land uses
Forest fire danger
The fire danger was high in 2 400 000 ha (46 of the surface) very high in 906 000 ha (17 ) andextreme in 85 923 ha (16 ) In Campeche the riskof fire by agricultural ignitions has more influencebut in Quintana Roo there is danger and risk for theaccumulation of fuels and the presence of rangelandand agricultural areas Considering only mediumtropical forests in Quintana Roo 1 800 000 ha hadhigh to extreme danger the danger is greater to the
East (Figure 6) The prevailing SE winds in spring(Suaacuterez and Rivera 1998) the fire season involveadditional danger because the fires will lead to areas
with more fuels The increase in fuel loading indicates danger notonly per se but also by the reduction in the canopycover which facilitates the drying and combustion ofmaterials brought down by hurricanes (Myers and
MODELAJE DEL PELIGRO DE INCENDIO FORESTAL EN LAS ZONAS AFECTADAS POR EL HURACAacuteN DEAN
605RODRIacuteGUEZ-TREJO et al
El aumento en la carga de combustibles indica pe-ligro no soacutelo per se sino tambieacuten por la reduccioacuten enla cobertura de copas que facilita el secado y la com-bustioacuten de los materiales derribados por huracanes
(Myers y van Lear 1998) En selvas los incendios su-perficiales pueden propiciar incendios subterraacuteneosdependiendo de la profundidad de los materiales or-gaacutenicos (Cochrane y Schulze 1999) entre otros fac-tores lo que genera maacutes severidad al quemar el suelo(Jain et al 2008) Histoacutericamente se han presentado incendios enregiones afectadas por huracanes en el sureste deMeacutexico 1) en las aacutereas afectadas por el huracaacuten Janet(deacutecada de 1950) 2) en1989 hubo incendios en 119233 ha en aacutereas afectadas por el huracaacuten Gilberto(Villa et al 1990) y 3) incendios forestales en 2009
en aacutereas impactadas por el huracaacuten Wilma en 2005 Asiacute la conjugacioacuten de factores como sequiacutea intensarelacionada con fenoacutemenos como el Nintildeo o la Nintildease presenta desde el mismo antildeo o hasta unos cua-tro antildeos despueacutes del paso del huracaacuten propiciandolos incendios forestales ante el continuo y ampliouso y mal uso del fuego en la regioacuten Seguacuten Cookeet al (2007) el paso de cualquier huracaacuten aumenta
van Lear 1998) In tropical forests surface fires cancause underground fires depending on the depthof organic materials (Cochrane and Schulze 1999)among other factors which generates more severity
when burning the soil (Jain et al 2008) Historically fires have been present in regionsaffected by hurricanes in southeastern Meacutexico1) in the affected areas by the hurricane Janet (decade1950) 2) in 1989 there were wildfires in 119 233 ha in areas affected by the Hurricane Gilberto (Villaet al 1990) y 3) forest fires in 2009 in areasimpacted by the Hurricane Wilma in 2005 Thusthe combination of factors such as severe droughtassociated with El Nintildeo or La Nintildea comes from thesame year or until about four years after the passageof the hurricane leading to the forest fires related
to the continued and broad use and misuse of firein the region According to Cooke et al (2007)the passage of any hurricane increases fuels andfire danger such as Katrina which increased from3 to 13 the areas with very high fire danger insouthern Mississippi High loads influences more on severe firesand on a low ecological restoration and forest
Figura 6 Mapa de iacutendice de peligro de incendio forestalFigure 6 Map of forest fire danger index
combustibles y peligro de incendio como Katrinaque incrementoacute de 3 a 13 las aacutereas con muy altopeligro de incendio al sur del Mississippi Las cargas altas repercuten en incendios maacutes seve-ros y en una lenta recuperacioacuten ecoloacutegica y de la pro-duccioacuten forestal asiacute como se favorece el cambio deuso del suelo Rodriacuteguez et al (1989) reportan que88 de los aacuterboles estaban derribados en las aacutereasafectadas por el huracaacuten Gilberto (1988) e incendiosforestales (1989) y 54 en las aacutereas afectadas soacutelopor huracaacuten
Aacutereas prioritarias de proteccioacuten
Estas aacutereas se concentran en Quintana Roo don-de estaacuten las mayores cargas de combustibles ade-maacutes estaacuten representadas por selvas medianas con
aprovechamiento forestal selvas medianas y otrostipos de vegetacioacuten como los humedales en las aacutereasnaturales protegidas de XianKaan Quintana Rooy Calakmul Campeche Hay aacutereas con aprovecha-miento forestal que antes del huracaacuten estaban enbuena condicioacuten y con bajo riesgo de incendio poractividades agropecuarias Sin embargo luego delos embates de los vientos huracanados estas aacutereaspueden degradarse maacutes en caso de incendios fores-tales pues son ecosistemas sensibles al fuego Lasaacutereas prioritarias de proteccioacuten estaacuten divididas enalta (gran acumulacioacuten de combustibles selvas bajo
manejo o de conservacioacuten) media (selvas bajas in-cluso en zonas con alto impacto del huracaacuten) y baja(en Campeche a reserva del riesgo de incendio poractividades agropecuarias) (Figura 7)
CONCLUSIONES
En la regioacuten hay maacutes de 2 millones ha con peligroalto muy alto o extremo de incendio forestal Debi-do a que en la definicioacuten de peligro de incendio setomoacute en cuenta la carga de todos los combustiblesforestales incluidos los combustibles pesados por
su lenta descomposicioacuten y disponibilidad durantela eacutepoca de sequiacutea y al extendido uso agropecuariodel fuego en la regioacuten la zonificacioacuten relativa a pe-ligro de incendio forestal y la de aacutereas prioritariasde atencioacuten estaraacuten vigentes durante varios antildeos
A mayor porte de la vegetacioacuten mayor la carga decombustibles generada como las selvas medianasque ademaacutes tienen la maacutes amplia distribucioacuten entre
production recovery as well as the change ofthe land use is favored Rodriacuteguez et al (1989)reported that 88 of the trees were felled in theareas affected by Hurricane Gilbert (1988) andforest fires (1989) and 54 in areas affected onlyby hurricane
Priority areas for protection
Priority forest areas for protection wereconcentrated in Quintana Roo where the highestloads of fuels are located in addition they arerepresented by rainforests with forest exploitationsemi-evergreen forests and other type of vegetationsuch as wetlands in the natural protected areasof XianKaan Quintana Roo and CalakmulCampeche There are areas with forest exploitation
that before the hurricane were in good conditionand with low risk of fire by agriculture-livestockactivities However after the strike of the hurricane
winds these areas may be more degraded in case offorest fires because they are fire-sensitive ecosystemsPriority areas for protection are divided into highpriority (large accumulation of fuels forests undermanagement or conservation) medium priority (lowtropical forests including areas with high impact ofhurricane) and low priority (in Campeche subject tothe fire risk by agricultural activities) (Figure 7)
CONCLUSIONS
In the region there are over 2 million ha withhigh very high or extreme forest fire danger Due tothe fact that in the definition of fire danger the loadof all forest fuels was taken into account includingthe heavy fuels by their slow decomposition andavailability during the drought season and the
widespread agricultural use of fire in the region thedivision into zones related to the forest fire dangerand the priority areas for protection will be in effectfor several years The higher the size of vegetation
the greatest the load of fuels generated such asmedium tropical forests which also have the widestdistribution among the forests of the area There wasa gradient of affected areas and loads of fuels withthe highest levels to the east and the lowest to the
west as the hurricane decreased its strength The higher level of risk corresponded to theeastern region with high loads and agriculture
MODELAJE DEL PELIGRO DE INCENDIO FORESTAL EN LAS ZONAS AFECTADAS POR EL HURACAacuteN DEAN
607RODRIacuteGUEZ-TREJO et al
las selvas de la zona Hubo un gradiente de afec-tacioacuten y cargas de combustibles con los mayoresniveles al este y los menores al oeste en la medidaen que el huracaacuten disminuyoacute su fuerza
El mayor nivel de peligro correspondioacute a la regioacuteneste con elevadas cargas y uso agropecuario de fuegoHacia el oeste con menores cargas las actividadesagropecuarias imprimen riesgo Las aacutereas prioritariasde proteccioacuten incluyen zonas con altos niveles de pe-ligro como las aacutereas bajo aprovechamiento forestallas reservas de la biosfera y poblaciones La hipoacutetesis se cumplioacute parcialmente pues detodas las variables probadas soacutelo el periacutemetro de lasaacutereas agropecuarias resultoacute significativo para estimarla presencia de incendios forestales Se considera quelos modelos utilizados fueron apropiados para alcan-
zar los objetivos planteados La informacioacuten de este estudio es uacutetil para quie-nes toman decisiones de manejo del fuego y de eco-sistemas en la regioacuten
A GRADECIMIENTOS
A CONAFOR que autorizoacute uso de datos del proyecto ldquoPro-
grama de prevencioacuten y combate de incendios forestales y manejo
livestock use of fire To the west with smaller loadsthe agriculturelivestock activities fix risk Priorityareas for protection include areas with high dangersuch as areas under forest exploitation the biospherereserves and populations
The hypothesis was partially fulfilled becausefrom all variables tested only the perimeter of theagricultural areas resulted significant to estimatethe presence of forest fires It is considered that themodels used were appropriate to achieve the posedobjectives The information of this study is useful todecision makers of fire management and ecosystemmanagement in the region
991252End of the English version991252
983152983152983152983158983120983120983120
del fuego en las aacutereas afectadas por el huracaacuten Dean en las aacutereas
tropicales del sureste de Meacutexicordquo elaborado por la UACH A
Ing Viacutector Sosa Cedillo Ing Roberto Martiacutenez Domiacutenguez Dr
J Germaacuten Flores G Dr Juan de D Benavides S y a los Ings o
MC Kuc Uc Gener D Juan O Hernaacutendez L Isaac Mendiola
G Mauricio R Castantildeeda M Rosa L Carrillo Diana Lahoz
Figura 7 Mapa de aacutereas prioritarias de proteccioacutenFigure 7 Map of priority areas for protection
G Karina Coliacuten Y Diana L Saacutenchez V G Elena Islas M y
Elsa Berenice
L ITERATURA CITADA
Arnaldos V J X Navaloacuten N E Pastor F E Planas C
y L Zaacuterate L 2004 Manual de Ingenieriacutea Baacutesica para laPrevencioacuten y Extincioacuten de Incendios Forestales MundiPrensa Madrid 414 p
Brown J K 1974 Handbook for Inventorying Downed WoodyMaterial USDA For Serv Gen Tech Rep INT-16
Challenger A y J Soberoacuten M 2008 Los ecosistemas terrestresVol I Conocimiento actual de la biodiversidad In SarukhaacutenK J Capital Natural de Meacutexico CONABIO Meacutexico DF pp 87-108
Chandler C P Cheney P Thomas L Trabaud and D Williams 1983 Fire in Forestry Vol II Wiley New York298 p
Cochrane M A and M D Schulze 1999 Fire as a recurrentevent in tropical forests of the eastern Amazon effects on
forest structure biomass and species composition Biotropica31 2-16Cochrane M A and K C Ryan 2009 Fire and fire ecology
concepts and principles In Cochrane M A (ed) TropicalFire Ecology Climate Change Land Use and EcosystemDynamics Springer-Praxis Chichester UK pp 25-62
Cooke W H K Grala D Evans and C Collins 2007 Assessment of pre- and post-Katrina fuel conditions asa component of fire potential modeling for SouthernMississippi J For (Dec) 389-397
Cressie N A C 1993 Statistics for Spatial Data Wiley New York 900 p
Cuesta R R M and J Martiacutenez V 2006 Effectiveness ofprotected areas in mitigating fire within their boundariesCase study of Chiapas Meacutexico Cons Biol 20(4) 1074-
1086Environmental Systems Research Institute 1999 Arc View GIS
32 Redland California USAFlores G J G O G Rodriacuteguez Ch M Meleacutendez G y O
G Rosas A 2008 Sitios de muestreo para el monitoreo decombustibles forestales SIMMCOF Centro de InvestigacioacutenRegional del Paciacutefico Centro Campo Experimental Centro Altos de Jalisco INIFAP Folleto Teacutecnico no 1 47 p
Gould W G Gonzaacutelez A T Hudak T Nettleton H and JHollingsworth 2008 Forest structure and downed woodydebris in boreal temperate and tropical forest fragments Ambio 37(7-8) 577-587
Hosmer D W and S Lemeshow 2000 Applied LogisticRegression Wiley New York 392 p
INEGI 2004 Carta de Uso del Suelo y Vegetacioacuten 1250 000Insightful Corporation 2002 S-plus v 8p for WindowsEnterprise Developer Edition Washington USA
Jain T B W A Gould R T Graham D S Pilliod L BLentile and G Gonzaacutelez 2008 A soil burn severity indexfor understanding soil-fire relations in tropical forests Ambio 37(7-8) 563-568
Loacutepez P J M Keyes A Gonzaacutelez E F Cabrera y O Saacutenchez1990 Los incendios de Quintana Roo iquestCataacutestrofe ecoloacutegicao evento perioacutedico Ciencia y Desarrollo 16(91) 43-57
Maeda E E A R Formaggio Y E Shimabukono G F B Arcoverde and M C Hansen 2009 Predicting forest firein the Brazilian Amazon using Modis imagery and artificialneural networks Int J Applied Earth Observation andGeoinformation 11(4) 265-272
Maeda E E G F B Arcoverde P K E Pellikka and Y EShimabukoro 2011 Fire risk assessment in the Brazilian Amazon using Modis imagery and change vector analysis Appl Geography 31(1) 76-84
Muntildeoz R C A E J Trevintildeo G J Veraacutestegui Ch J JimeacutenezP y O A Aguirre C 2005 Desarrollo de un modeloespacial para la evaluacioacuten del peligro de incendios forestalesen la Sierra Madre Oriental de Meacutexico InvestigacionesGeograacuteficas 56 101-117
Myers R K and D H van Lear 1998 Hurricane-fireinteractions in coastal forests of the south a review andhypothesis For Ecol Manag 103 265-276
Neri A C D A Rodriacuteguez T y R Contreras A 2008Inflamabilidad de combustibles forestales en las selvas deCalakmul Campeche Universidad y Ciencia 25(2) 125-132
Pyne S J P L Andrews and R D Laven 1996 Introductionto Wildland Fire 2nd ed Wiley New York 769 p
Ripley B D 1981 Spatial Statistics Wiley New York 252 pRodriacuteguez F C G Vera C F Carrillo A J Chavelas P J C
Escoto P y C Paraguirre L 1989 Evaluacioacuten de dantildeos en lazona afectada por el huracaacuten Gilberto y el incendio ocurridoel presente antildeo CIFAP-Meacutex Reporte Teacutecnico 100 p
Rodriacuteguez T D A H Ramiacuterez M H Tchikoueacute y J SantillaacutenP 2008 Factores que inciden en la siniestralidad de incendios
forestales Ciencia For Meacutex 33(104) 37-58SAS Institute 2002 Statistical Analysis System v 90 for
Microcomputers Cary North Carolina USASuaacuterez M E y E Rivera A 1998 Zooplancton e hidrodinaacutemica
en zonas litorales y arrecifales de Quintana Roo MeacutexicoHidrobioloacutegica 8 19-32
Uriarte M and M Papaik 2007 Hurricane impacts ondynamics structure and carbon sequestration potential offorest ecosystems in southern New England USA Tellus59A 519-528
Van Wagner C E and T L Picket 1985 Equations andFORTRAN program for the Canadian Forest Fire WeatherIndex System Forestry Technical Report 33 CanadianForest Service Ottawa Ontario 18 p
Villa S A B E A Hernaacutendez O y V E Sosa C (eds)1990 Plan de manejo silviacutecola integral de la zona norte deQuintana Roo AMPF A C Meacutexico D F 100 p
Histoacutericamente los combustibles generadospor huracanes aumentan el peligro de in-cendio como ha sucedido con los huraca-
nes Carmen (en 1974) Gilberto (en 1988) Roxanne(en 1995) Emily y Wilma (en 2005) (CONAFOR2006)[4] A pesar de ser comunes y del extenso efectoque con frecuencia originan estos meteoros su im-pacto ha sido poco estudiado La interaccioacuten entre huracanes e incendios fores-tales en los bosques tropicales ocurre desde hace mi-llones de antildeos (Loacutepez et al 1990 Myers y van Lear1998) Si se agrega el efecto de factores antroacutepicoscomo el cambio de uso del suelo y el mal uso del fue-go resulta deforestacioacuten y fragmentacioacuten en los bos-ques tropicales sensibles al fuego Asiacute Rodriacuteguez et
al (2008) anotan que la superficie de aacutereas perturba-das o el apoyo financiero al productor agropecuarioentre otros factores se correlacionan con la superficieafectada por incendios en Meacutexico El 21 de agosto de 2007 el huracaacuten Dean arri-boacute a la costa de Quintana Roo y se dirigioacute al oestecon una velocidad de 260 km h1 y rachas de hasta315 km h1 El meteoro damnificoacute a la poblacioacutenincrementoacute el peligro de incendio afectoacute las exis-tencias maderables los avances en ordenamiento ymanejo forestal proyectos ecoturiacutesticos plantacionescomerciales infraestructura de caminos y aserrade-
ros (CONAFOR-SEMARNAT 2007)[5]
Las selvasresguardan gran parte de la biodiversidad mundialy de Meacutexico (Challenger y Soberoacuten 2008) pero elpaso del huracaacuten el peligro de incendio derivado delmismo y la sensibilidad de estos ecosistemas al fuegoamenazan tal biodiversidad El peligro de incendio forestal es resultado de fac-tores constantes y variables que afectan el inicio lapropagacioacuten y la dificultad de su control Entre talesfactores destacan topografiacutea carga de combustiblesy tiempo atmosfeacuterico (Chandler et al 1983) La to-pografiacutea es sensiblemente plana en Quintana Roo
por lo que se consideroacute que su efecto es relativamenteuniforme y no se tomoacute en cuenta El huracaacuten Deanprodujo distintas acumulaciones de combustibles
Hurricane-fire interactions in tropical forestsoccur over millions of years (Loacutepez et al 1990Myers and van Lear 1998) By adding the effectof anthropical factors such as changing land useand misuse of fire this results in deforestation andfragmentation in fire-sensitive tropical forests ThusRodriacuteguez et al (2008) point out that the surface ofdisturbed areas or financial support to agriculturalproducers among other factors are correlated withthe surface affected by fires in Meacutexico On August 21 2007 Hurricane Dean reachedthe coast of Quintana Roo and headed west
with a speed of 260 km h1 and wind gusts ofup to 315 km h1 The hurricane affected thepopulation increased fire hazard affected timberstocks advances in forest management ecotourismprojects commercial plantations infrastructure of
roads and sawmills (CONAFOR-SEMARNAT2007)[5] Forests shelter a large part of global andMeacutexico biodiversity (Challenger and Soberoacuten2008) but the passage of hurricane the firehazard derived from it and the sensitivity of theseecosystems to fire threat such biodiversity
The forest fire danger is result of constant andvariable factors affecting the start propagationand difficult to control it Such factors includetopography fuel load and weather (Chandleret al 1983) Topography is substantially flat inQuintana Roo so it is considered that its effect
is relatively uniform and was not taken intoaccount Hurricane Dean caused various forestfuel accumulations throughout the affected areaand its load itself was considered Many indicesuse meteorological variables but others do not(Pyne et al 1996) In the present study thesevariables were not included The variables relatedto agricultural activities (43 of fire causes inMeacutexico) were included To estimate the forest fire danger the risk factorschosen in one or more numerical or qualitativeindices related to the need for protection are
integrated (Chandler et al 1983) Research onestimation of fire hazard in tropical areas affected byhurricanes is very scarce In the Amazons Maeda et
4 CONAFOR (Comisioacuten Nacional Forestal) 2006 Evaluacioacuten del riesgo de incendios forestales por el huracaacuten ldquoWilmardquo 2005 QuintanaRoo CONAFOR Reporte teacutecnico (ineacutedito)5 CONAFOR-SEMARNAT 2007 Programa emergente para la prevencioacuten y combate de incendios forestales zona centro-sur del estadode Quintana Roo Reporte teacutecnico (ineacutedito)
MODELAJE DEL PELIGRO DE INCENDIO FORESTAL EN LAS ZONAS AFECTADAS POR EL HURACAacuteN DEAN
595RODRIacuteGUEZ-TREJO et al
forestales a lo largo y ancho del aacuterea afectada y sucarga siacute fue contemplada Muchos iacutendices empleanvariables meteoroloacutegicas pero otros no (Pyne et al 1996) En el presente estudio no se incluyeron dichasvariables pero siacute las relativas a actividades agropecua-rias (43 de las causas de incendio en Meacutexico) Para estimar el peligro de incendio forestal se in-tegra los factores de peligro elegidos en uno o maacutesiacutendices numeacutericos o cualitativos relacionados con lanecesidad de proteccioacuten (Chandler et al 1983) Lainvestigacioacuten sobre estimacioacuten de peligro de incendioen aacutereas tropicales afectadas por huracanes es muy es-casa En el Amazonas Maeda et al (2011) utilizaronanaacutelisis vectorial para estimar el riesgo de incendioforestal con las variables aacutereas agriacutecolas y bosque condiferentes niveles de perturbacioacuten o con variables deuso del suelo y su dinaacutemica de cambio empleando
redes neuronales artificiales (Maeda et al 2009)Para estimar el peligro de incendio en aacutereas templa-das de la Sierra Madre Oriental Meacutexico Muntildeoz etal (2005) integraron variables de carga de combus-tibles forestales meteoroloacutegicas y antroacutepicas usandoanaacutelisis espacial multicriterio En zonas templadas deNueva Inglaterra (EEUU) la elevada carga de com-bustibles acumulada tras el paso de huracanes es elprincipal factor que incrementa el peligro de incen-dio (Uriarte y Papaik 2007) Por lo anterior los objetivos del presente estudiofueron 1) determinar la disposicioacuten espacial y patro-
nes de distribucioacuten de cargas de combustibles foresta-les producto del Huracaacuten Dean 2) evaluar el peligrode incendio y 3) determinar aacutereas de proteccioacuten prio-ritaria y elaborar la cartografiacutea respectiva La hipoacutetesisfue que el peligro de incendio forestal aumenta con lacarga de combustibles forestales y con el nuacutemero deaacutereas agriacutecolas o su superficie o su periacutemetro asiacute comocon la densidad o la longitud de caminos
M ATERIALES Y MEacuteTODOS
Aacuterea de estudio y muestreo de combustibles
El aacuterea de trabajo incluyoacute el centro y sur de Quintana Roo el
este de Campeche y el sur de Yucataacuten (Figura 1) y el muestreo se
hizo al azar por conglomerados en el 2007 Cada conglomerado
estuvo compuesto por tres liacuteneas principales para muestreo de
combustibles lentildeosos seguacuten Brown (1974) orientadas a 0 120
y 240deg de azimut y dos cuadros de 0303 m para hojarasca y
capa de fermentacioacuten (Flores et al 2008)
al (2011) used vector analysis to estimate the forestfire hazard with the agricultural and forest areavariables at different levels of disturbance or land usevariables and its dynamics of change using artificialneuronal networks (Maeda et al 2009) To estimatethe fire hazard in temperate areas of the Sierra MadreOriental Meacutexico Muntildeoz et al (2005) integratedvariables of forest fuel load meteorological andanthropical using multi-criteria spatial analysis Intemperate areas of New England (USA) the highestfuel load accumulated after the passage of hurricanesis the main factor increasing the fire hazard (Uriarteand Papaik 2007) Therefore the objectives of this study were1) to determine the spatial arrangement andpatterns of distribution of forest fuel loads result ofHurricane Dean 2) evaluate the danger of fire and
3) determine priority protection areas and developthe respective mapping The hypothesis was thatthe forest fire danger increases with forest fuelloads and the number of agricultural areas or theirsurface or their perimeter as well as the density orlength of roads
M ATERIALS AND METHODS
Study area and fuel sampling
The study area included the central and southern part of
the state of Quintana Roo eastern Campeche and southern Yucataacuten (Figure 1) and sampling was carried out at random by
conglomerates in 2007 Each conglomerate consisted of three
main lines for sampling of woody fuels according to Brown
(1974) oriented at 0 120 and 240deg azimuth and two squares
of 0303 m for litter and fermentation layer (Flores et al
2008)
The sampling lines were 14 m long and divided into four
segments to measure different types of fuel according to the
timelag classes (TL) of woody fuels 35 m (TL1 h and
TL10 h) 7 m (TL100 h) and 14 m (TL1000 h) Samples
of litter and fermentation layer were collected dried in the
laboratory and their load was calculated Samples were collectedin 165 conglomerates 330 sites for litter and fermentation
layer and 1980 lines for woody fuel The sampling intensity
corresponded to a line for sampling of woody fuels per each
2803 ha The center of each conglomerate was geo-referenced
with a geopositioner (GPS) The sample was distributed over
1 400 000 ha obtaining 81 33 and 41 conglomerates in
areas of high medium and low affected areas plus 10 next to
Carga total de combustibles forestales Nuacutemero de aacutereas agriacutecolas o pecuarias por cuadro de 55 km Aacuterea de aacutereas agriacutecolas o pecuarias por cuadro de 55 km
Periacutemetro de aacutereas agriacutecolas o pecuarias por cuadro de 55 kmDensidad de caminos (nuacutemero de ramales ha 1) por cuadro de 55 km
Longitud de caminos (kmha) por cuadro de 55 km
6 CONAFOR (Comisioacuten Nacional Forestal) 2009 Reporte de incendios forestales CONAFOR Folleto
este caso las estimaciones fueron θ0 435 2= θ1 989 5= α=8 2506 y pseudo-R 2 094 El efecto de tendencia en las
coordenadas fue no significativo α=( )0 84 y debido a esto
tambieacuten se utilizoacute un krigado ordinario para predecir esta va-
riable respuesta El error estaacutendar residual obtenido de la esti-
macioacuten fue 304 unidades de carga total Aunque en ocasiones se realizan particiones del conjunto
de observaciones y con base en eacutestas se hacen predicciones
que permiten la validacioacuten cruzada auacuten hay controversia de
la validez de tales teacutecnicas bajo algunas estructuras de auto-
correlacioacuten (Cressie 1993) Asiacute en este caso se consideraron
criterios suficientes la optimalidad predictiva del krigado y
el ajuste satisfactorio de los semi-varigramas muestrales Las
Figuras 3 y 4 muestran los semi-variogramas estimados
Las estimaciones requeridas se efectuaron usando funciones
escritas por el usuario en el programa S-Plus y usando el moacutedulo
Spatial Statistics V 15 (Insightful Corporation 2002) La sis-
tematizacioacuten de datos de los sitios de muestreo se realizoacute con elSIG Arc View (v 32 Environmental Systems Research Institute
1999) para obtener mapas
R ESULTADOS Y DISCUSIOacuteN
La superficie afectada a distintas intensidades fue1 278 589 ha (alta intensidad) 986 979 ha (media)y 2 788 971 ha (baja) 5 054 539 ha en total La sel-va mediana subperennifolia tuvo 840 620 ha de altaafectacioacuten por su amplia extensioacuten donde el huracaacutencausoacute los mayores impactos en la regioacuten este de la
Peniacutensula de Yucataacuten
case the estimates were θ0 435 2= θ1 989 5= α=8 2506
and pseudo-R 2 094 The effect of trend in the coordinates
was not significant α=( )0 84 and because of this it was also
used an ordinary kriging to predict this response variable The
residual standard error obtained from the estimation was 304
units of total load Although sometimes partitions of the set of observations are
carried out and based on these partitions predictions are made
that allow cross-validation there is still controversy as to the
validity of such techniques in some structures of autocorrelation
(Cressie 1993) So in this case sufficient criteria were considered
the predictive optimality of kriging and the satisfactory
adjustment of the sample semi-variogramas Figures 3 and 4
show the estimated semi-variograms
The required estimations were done using functions written
by the user in the program S-Plus and using the module
Spatial Statistics V 15 (Insightful Corporation 2002) Data
systematization of the sampled sites was performed with the SIG Arc View (v 32 Environmental Systems Research Institute
1999) to obtain maps
R ESULTS AND DISCUSSION
The area affected at different intensities was1 278 589 ha (high intensity) 986 979 ha (mediumintensity) and 2 788 971 ha (low intensity)5 054 539 ha in total The medium semi-evergreentropical forest had 840 620 ha of high damage for its
wide extension where the hurricane cause the greatest
impact in the eastern region of the Yucataacuten peninsula
Figura 4 Semi-variograma estimado para la variable cargatotal
Figure 4 Semi-variogram estimated for the total load variable
Figura 3 Semivariograma estimado para la variable iacutendicede peligro
Figure 3 Semi-variogram estimated for the danger index variable
MODELAJE DEL PELIGRO DE INCENDIO FORESTAL EN LAS ZONAS AFECTADAS POR EL HURACAacuteN DEAN
601RODRIacuteGUEZ-TREJO et al
Carga de combustibles forestales
La categoriacutea de carga maacutes comuacuten fue del intervalo20 a 40 Mg ha 1 (2 200 000 ha 431 de la su-perficie) seguida por las clases de 40 a 60 Mg ha 1 (1 200 000 ha 229 ) y20 Mg ha 1 (1 400 000 ha281 ) (Cuadro 2) Las mayores cargas (60 Mgha 1) se observaron en Quintana Roo en selvas me-dianas (Cuadro 2) en aacutereas de importancia forestal ode conservacioacuten como la Organizacioacuten de Produc-tores Canan karsquoachx y parte de la Reserva Xian Kaan(Figura 5) destacando asiacute la necesidad de protegerlasLa carga media fue 404 Mg ha 1 (maacuteximo 137 ymiacutenimo 109 Mg ha 1) La maacutexima se observoacute enselva mediana subperennifolia y fue menor al maacutexi-mo de 1791 Mg ha 1 referido por CONAFOR etal (2005)[7] en aacutereas afectadas por el Huracaacuten Wilma
en 2005 aunque este uacuteltimo usoacute muestreo selecti-vo Los combustibles lentildeosos con un TR de 1000 hrepresentaron casi 30 de la carga media (11994Mg ha 1) en tanto que el total de los combustibleslentildeosos alcanzoacute casi 64
En bosques tropicales huacutemedos no perturbados247 de la carga correspondioacute a combustibles conTR de 1000 h en tanto que 369 fue hojarascay capa de fermentacioacuten (Gould et al 2008) Es-tas proporciones son semejantes a las halladas en el
Forest fuel load
The most common load category was in therange 20 to 40 Mg ha 1 (2 200 000 ha 431 ofthe surface) followed by classes from 40 to 60 Mgha 1 (1 200 000 ha 229 ) and 20 Mg ha 1 (1400 000 ha 281 ) (Table 2) The higher loads(60 Mg ha 1) were observed in Quintana Rooin medium tropical forests (Table 2) in areas offorest importance or conservation areas such as theOrganization of Producers of Canan karsquoachx and partof the Xian Kaan Reserve (Figure 5) emphasizingthus the need to protect them The average load
was 404 Mg ha 1 (maximum 137 and minimum109 Mg 1) The maximum was observed in a semi-evergreen forest and was less than the maximum of1791 Mg ha 1 referred to by CONAFOR et al
(2005)[7]
in areas affected by Hurricane Wilma in2005 although the latter used selective samplingThe woody fuels with a TL of 1000 h accounted foralmost 30 of the average load (11994 Mg ha 1)
while the total wood fuels reached almost 64 In undisturbed tropical rain forests 247 ofthe load corresponded to fuels with TL of 1000h while 369 was litter and fermentation layer(Gould et al 2008) These percentages are similarto those found in this study The proportion of fuels
Cuadro 2 Superficie (ha) por categoriacutea de carga de combustibles y tipo de vegetacioacuten
Table 2 Area (ha) by category of fuel loads and vegetation type
presente estudio La proporcioacuten de combustibles conTR 1000 h no exhibioacute cambios importantes en losdistintos niveles de afectacioacuten Los promedios de laproporcioacuten de combustibles con TR 1000 h fueron
292 289 y 271 para las intensidades alta mediay baja A su vez la proporcioacuten de hojarasca y capa defermentacioacuten fue 383 390 y 307 con lo quetodos estos combustibles mantienen su proporcioacutena distintos niveles de afectacioacuten aunque su carga siacutecambie (Cuadro 3)
Cargas por tipo de vegetacioacuten
En las zonas de alta afectacioacuten la selva medianasubperennifolia tuvo una carga media de 496 Mgha 1 mayor que en la selva baja subperennifolia
(386 Mg ha 1) La maacutexima carga (137 Mg ha 1)correspondioacute a selva mediana con afectacioacuten alta(Cuadro 3) La carga media entre tipos de vegeta-cioacuten en la zona de alto impacto fue 488 Mg ha 1Respecto a zonas de afectacioacuten media la selva me-diana subcaducifolia (383 Mg ha 1) y la medianasubperennifolia (382 Mg ha 1) superaron a la selvabaja subperennifolia (348 Mg ha 1) En este nivel
with TL 1000 h showed no significant changes inthe different levels of damage The average ratios offuel with TL 1000 h were 292 289 and 271 for high medium and low intensities In turn the
litter and fermentation layer ratio was 383 390and 307 with what all of these fuels maintaintheir ratio to different levels of damage althoughdoes change its load (Table 3)
Loads per vegetation type
In areas of high damage the semi-evergreentropical forest had a medium load of 496 Mgha 1 higher than the low-evergreen tropicalforest (386 Mg ha 1) The maximum load(137 Mg ha 1) corresponded to medium forest
tropical which was highly affected (Table 3) Themedium load between types of vegetation in thearea of high impact was 488 Mg ha 1 Withregard to areas of medium damage the mediumsub-deciduous tropical forest (383 Mg ha 1)and the semi-evergreen tropical forest (382 Mgha 1) exceeded the low semi-evergreen tropicalforest (348 Mg ha 1) In this level of damage the
Figura 5 Mapa de cargas de combustibles forestalesFigure 5 Map of loads of forest fuels
MODELAJE DEL PELIGRO DE INCENDIO FORESTAL EN LAS ZONAS AFECTADAS POR EL HURACAacuteN DEAN
603RODRIacuteGUEZ-TREJO et al
maximum load was 847 Mg ha 1 in the semi-evergreen tropical forest and the average betweentypes of vegetation was 382 Mg ha 1 For areas
with low damage the low semi-evergreen tropicalforest showed the highest average (374 Mg ha 1)followed by the medium semi-evergreen tropicalforest (337 Mg h1) and the medium semi-deciduous tropical forest (162 Mg ha 1) Theaverage load in this level of damage was 295 Mgha 1 Similarly Rodriacuteguez et al (1998) report thatthe load increased in vegetation types with more
biomass as high and medium tropical forests afterthe passage of Hurricane Gilbert The means of 496 382 and 337 Mg ha 1 for thelevels of high to low affected areas in medium semi-evergreen tropical forest (2 700 000 ha affected) arehigher than the loads reported by Gould et al (2008)of 279 Mg ha 1 and 197 Mg ha 1 in rainforestsand seasonal tropical forests both undisturbed forests
Analysis by type of fuels
Based on the estimates (response surfaces) of
forest fuels (not shown) litter and fermentationlayer show their highest values to the northeast andsoutheast of the studied area Of woody materials
with 1 h of TL the highest loads are seen in thesoutheast and east-central sectors of the most affectedarea (east) The distribution of these fine materialsis relevant because according to Pyne et al (1996)control the direction of fire spread Moreover the
Cuadro 3 Cargas de combustibles forestales (Mg ha 1) por nivel de afectacioacuten del huracaacutenTable 3 Forest fuel loads (Mg ha 1) by level of affected areas by hurricane
F firmes P en descomposicioacutenv F solid P in decomposition
de afectacioacuten la carga maacutexima fue 847 Mg ha 1 enselva mediana subperennifolia y la media entre tiposde vegetacioacuten fue 382 Mg ha 1 Para las aacutereas conbaja afectacioacuten la selva baja subperennifolia mostroacuteel mayor promedio (374 Mg ha 1) seguida por lamediana subperennifolia (337 Mg ha 1) y la media-na subcaducifolia (162 Mg ha 1) La carga media eneste nivel de afectacioacuten fue 295 Mg ha 1 Similar-mente Rodriacuteguez et al (1989) refieren que la cargaaumentoacute en tipos de vegetacioacuten con maacutes biomasacomo las selvas altas y medianas luego del paso del
huracaacuten Gilberto Las medias de 496 382 y 337 Mg ha 1 paralos niveles de afectacioacuten alto a bajo en selva medianasubperennifolia (2 700 000 ha afectadas) son supe-riores a las cargas reportadas por Gould et al (2008)de 279 Mg ha 1 y 197 Mg ha 1 en bosques tropi-cales huacutemedos y en los secos ambos no perturbados
Anaacutelisis por clase de combustibles
Con base en las estimaciones (superficies de res-puesta) de los combustibles forestales (no mostra-
das) la hojarasca y la capa de fermentacioacuten exhibensus mayores valores hacia el noreste y el sureste dela zona estudiada De los materiales lentildeosos con 1 hde TR las mayores cargas se aprecian en los sectoressureste y centro-este de la zona de mayor afectacioacuten(este) La distribucioacuten de estos materiales finos esrelevante porque seguacuten Pyne et al (1996) contro-lan la direccioacuten de propagacioacuten del fuego Ademaacutes
el patroacuten y caracteriacutesticas de combustibles como ho- jarasca y capa de fermentacioacuten influyen en la pro-babilidad de incendios subterraacuteneos los que emitenmaacutes partiacuteculas suspendidas a la atmoacutesfera (Cochraney Ryan 2009) La capa de fermentacioacuten tarda maacutesque la hojarasca en iniciar su combustioacuten pero libe-ra maacutes energiacutea y hace maacutes severos los incendios sub-terraacuteneos comparados con los superficiales (Neri etal 2008) Los incendios subterraacuteneos son difiacutecilesde combatir y con frecuencia imparables Los com-bustibles con 10 h de TR tuvieron una tendenciasimilar a los de 1 h de TR La mayor concentracioacutende combustibles con 100 h de TR estaacute en la porcioacutenNE y en la centro-este En anaacutelisis combinado decombustibles de 1-100 h de TR la tendencia de losde 100 h prevalece Hay cargas altas de combustibles lentildeosos con TR
de 1000 h desde la costa hasta los liacutemites de Yucataacuteny Campeche por la peacuterdida de fuerza del huracaacutenCon materiales maacutes pesados como estos uacuteltimos elfuego adquiere mayor intensidad lo que dificulta elcontrol (Pyne et al 1996) ademaacutes cuentan con ma-yor tiempo de residencia Finalmente la carga totalmuestra una tendencia semejante a la anterior Paratodos los combustibles lentildeosos hay picos intercala-dos entre partes maacutes o menos planas u onduladasEste comportamiento y la relativa escasez de com-bustibles con TR de 1 y 10 h al NE y una relativa-mente menor presencia de combustibles con TR de
100 h al SE obedecen a distintos efectos del huracaacutenen regiones con diferentes tipos y proporciones deselvas y usos de suelo
Peligro de incendio forestal
El peligro de incendio fue alto en 2 400 000 ha(46 de la superficie) muy alto en 906 000 ha(17 ) y extremo en 85 923 ha (16 ) En Cam-peche influye maacutes el riesgo de incendio por igni-ciones agropecuarias pero en Quintana Roo haypeligro y riesgo por la acumulacioacuten de combustibles
y la presencia de agostaderos y aacutereas agriacutecolas Con-siderando soacutelo selvas medianas en Quintana Roo1 800 000 ha tuvieron peligro de alto a extremoel peligro es mayor al E (Figura 6) Los vientos delSE dominantes en la primavera (Suaacuterez y Rivera1998) la temporada de incendios implican peligroadicional pues dirigiraacuten los incendios a aacutereas conmaacutes combustibles
pattern and characteristics of fuels such as litterand layer of fermentation influence the likelihoodof underground fires which emit more particulatematter into the atmosphere (Cochrane and Ryan2009) The fermentation layer takes longer thanlitter to start burning but it releases more energyand makes more severe underground fires comparedto surface fires (Neri et al 2008) The undergroundfires are difficult to control and often they areunstoppable Fuels with 10 h of TL had a trendsimilar to the 1 h of TL The highest concentrationof fuels with 100 h of TL is at NE and Central-Eastsections In combined analysis of fuels of TL 1-100 hthe trend of 100 h prevails
There are high loads of woody fuels with TL of1000 h from the coast to the borders of Yucataacutenand Campeche due to the loss of strength of the
hurricane With heavier materials like the latter thefire becomes more intense making it difficult tocontrol (Pyne et al 1996) also they are those thathave longer residence time Finally the total loadshows a similar trend to the previous one For all
woody fuels there are peaks interspersed betweenparts more or less flat or wavy This trend and therelative scarcity of fuels with TR of 1 and 10 h to NEand a relatively smaller presence of fuels with TL of100 h to SE are due to various effects of the hurricanein regions with different types and proportions offorests and land uses
Forest fire danger
The fire danger was high in 2 400 000 ha (46 of the surface) very high in 906 000 ha (17 ) andextreme in 85 923 ha (16 ) In Campeche the riskof fire by agricultural ignitions has more influencebut in Quintana Roo there is danger and risk for theaccumulation of fuels and the presence of rangelandand agricultural areas Considering only mediumtropical forests in Quintana Roo 1 800 000 ha hadhigh to extreme danger the danger is greater to the
East (Figure 6) The prevailing SE winds in spring(Suaacuterez and Rivera 1998) the fire season involveadditional danger because the fires will lead to areas
with more fuels The increase in fuel loading indicates danger notonly per se but also by the reduction in the canopycover which facilitates the drying and combustion ofmaterials brought down by hurricanes (Myers and
MODELAJE DEL PELIGRO DE INCENDIO FORESTAL EN LAS ZONAS AFECTADAS POR EL HURACAacuteN DEAN
605RODRIacuteGUEZ-TREJO et al
El aumento en la carga de combustibles indica pe-ligro no soacutelo per se sino tambieacuten por la reduccioacuten enla cobertura de copas que facilita el secado y la com-bustioacuten de los materiales derribados por huracanes
(Myers y van Lear 1998) En selvas los incendios su-perficiales pueden propiciar incendios subterraacuteneosdependiendo de la profundidad de los materiales or-gaacutenicos (Cochrane y Schulze 1999) entre otros fac-tores lo que genera maacutes severidad al quemar el suelo(Jain et al 2008) Histoacutericamente se han presentado incendios enregiones afectadas por huracanes en el sureste deMeacutexico 1) en las aacutereas afectadas por el huracaacuten Janet(deacutecada de 1950) 2) en1989 hubo incendios en 119233 ha en aacutereas afectadas por el huracaacuten Gilberto(Villa et al 1990) y 3) incendios forestales en 2009
en aacutereas impactadas por el huracaacuten Wilma en 2005 Asiacute la conjugacioacuten de factores como sequiacutea intensarelacionada con fenoacutemenos como el Nintildeo o la Nintildease presenta desde el mismo antildeo o hasta unos cua-tro antildeos despueacutes del paso del huracaacuten propiciandolos incendios forestales ante el continuo y ampliouso y mal uso del fuego en la regioacuten Seguacuten Cookeet al (2007) el paso de cualquier huracaacuten aumenta
van Lear 1998) In tropical forests surface fires cancause underground fires depending on the depthof organic materials (Cochrane and Schulze 1999)among other factors which generates more severity
when burning the soil (Jain et al 2008) Historically fires have been present in regionsaffected by hurricanes in southeastern Meacutexico1) in the affected areas by the hurricane Janet (decade1950) 2) in 1989 there were wildfires in 119 233 ha in areas affected by the Hurricane Gilberto (Villaet al 1990) y 3) forest fires in 2009 in areasimpacted by the Hurricane Wilma in 2005 Thusthe combination of factors such as severe droughtassociated with El Nintildeo or La Nintildea comes from thesame year or until about four years after the passageof the hurricane leading to the forest fires related
to the continued and broad use and misuse of firein the region According to Cooke et al (2007)the passage of any hurricane increases fuels andfire danger such as Katrina which increased from3 to 13 the areas with very high fire danger insouthern Mississippi High loads influences more on severe firesand on a low ecological restoration and forest
Figura 6 Mapa de iacutendice de peligro de incendio forestalFigure 6 Map of forest fire danger index
combustibles y peligro de incendio como Katrinaque incrementoacute de 3 a 13 las aacutereas con muy altopeligro de incendio al sur del Mississippi Las cargas altas repercuten en incendios maacutes seve-ros y en una lenta recuperacioacuten ecoloacutegica y de la pro-duccioacuten forestal asiacute como se favorece el cambio deuso del suelo Rodriacuteguez et al (1989) reportan que88 de los aacuterboles estaban derribados en las aacutereasafectadas por el huracaacuten Gilberto (1988) e incendiosforestales (1989) y 54 en las aacutereas afectadas soacutelopor huracaacuten
Aacutereas prioritarias de proteccioacuten
Estas aacutereas se concentran en Quintana Roo don-de estaacuten las mayores cargas de combustibles ade-maacutes estaacuten representadas por selvas medianas con
aprovechamiento forestal selvas medianas y otrostipos de vegetacioacuten como los humedales en las aacutereasnaturales protegidas de XianKaan Quintana Rooy Calakmul Campeche Hay aacutereas con aprovecha-miento forestal que antes del huracaacuten estaban enbuena condicioacuten y con bajo riesgo de incendio poractividades agropecuarias Sin embargo luego delos embates de los vientos huracanados estas aacutereaspueden degradarse maacutes en caso de incendios fores-tales pues son ecosistemas sensibles al fuego Lasaacutereas prioritarias de proteccioacuten estaacuten divididas enalta (gran acumulacioacuten de combustibles selvas bajo
manejo o de conservacioacuten) media (selvas bajas in-cluso en zonas con alto impacto del huracaacuten) y baja(en Campeche a reserva del riesgo de incendio poractividades agropecuarias) (Figura 7)
CONCLUSIONES
En la regioacuten hay maacutes de 2 millones ha con peligroalto muy alto o extremo de incendio forestal Debi-do a que en la definicioacuten de peligro de incendio setomoacute en cuenta la carga de todos los combustiblesforestales incluidos los combustibles pesados por
su lenta descomposicioacuten y disponibilidad durantela eacutepoca de sequiacutea y al extendido uso agropecuariodel fuego en la regioacuten la zonificacioacuten relativa a pe-ligro de incendio forestal y la de aacutereas prioritariasde atencioacuten estaraacuten vigentes durante varios antildeos
A mayor porte de la vegetacioacuten mayor la carga decombustibles generada como las selvas medianasque ademaacutes tienen la maacutes amplia distribucioacuten entre
production recovery as well as the change ofthe land use is favored Rodriacuteguez et al (1989)reported that 88 of the trees were felled in theareas affected by Hurricane Gilbert (1988) andforest fires (1989) and 54 in areas affected onlyby hurricane
Priority areas for protection
Priority forest areas for protection wereconcentrated in Quintana Roo where the highestloads of fuels are located in addition they arerepresented by rainforests with forest exploitationsemi-evergreen forests and other type of vegetationsuch as wetlands in the natural protected areasof XianKaan Quintana Roo and CalakmulCampeche There are areas with forest exploitation
that before the hurricane were in good conditionand with low risk of fire by agriculture-livestockactivities However after the strike of the hurricane
winds these areas may be more degraded in case offorest fires because they are fire-sensitive ecosystemsPriority areas for protection are divided into highpriority (large accumulation of fuels forests undermanagement or conservation) medium priority (lowtropical forests including areas with high impact ofhurricane) and low priority (in Campeche subject tothe fire risk by agricultural activities) (Figure 7)
CONCLUSIONS
In the region there are over 2 million ha withhigh very high or extreme forest fire danger Due tothe fact that in the definition of fire danger the loadof all forest fuels was taken into account includingthe heavy fuels by their slow decomposition andavailability during the drought season and the
widespread agricultural use of fire in the region thedivision into zones related to the forest fire dangerand the priority areas for protection will be in effectfor several years The higher the size of vegetation
the greatest the load of fuels generated such asmedium tropical forests which also have the widestdistribution among the forests of the area There wasa gradient of affected areas and loads of fuels withthe highest levels to the east and the lowest to the
west as the hurricane decreased its strength The higher level of risk corresponded to theeastern region with high loads and agriculture
MODELAJE DEL PELIGRO DE INCENDIO FORESTAL EN LAS ZONAS AFECTADAS POR EL HURACAacuteN DEAN
607RODRIacuteGUEZ-TREJO et al
las selvas de la zona Hubo un gradiente de afec-tacioacuten y cargas de combustibles con los mayoresniveles al este y los menores al oeste en la medidaen que el huracaacuten disminuyoacute su fuerza
El mayor nivel de peligro correspondioacute a la regioacuteneste con elevadas cargas y uso agropecuario de fuegoHacia el oeste con menores cargas las actividadesagropecuarias imprimen riesgo Las aacutereas prioritariasde proteccioacuten incluyen zonas con altos niveles de pe-ligro como las aacutereas bajo aprovechamiento forestallas reservas de la biosfera y poblaciones La hipoacutetesis se cumplioacute parcialmente pues detodas las variables probadas soacutelo el periacutemetro de lasaacutereas agropecuarias resultoacute significativo para estimarla presencia de incendios forestales Se considera quelos modelos utilizados fueron apropiados para alcan-
zar los objetivos planteados La informacioacuten de este estudio es uacutetil para quie-nes toman decisiones de manejo del fuego y de eco-sistemas en la regioacuten
A GRADECIMIENTOS
A CONAFOR que autorizoacute uso de datos del proyecto ldquoPro-
grama de prevencioacuten y combate de incendios forestales y manejo
livestock use of fire To the west with smaller loadsthe agriculturelivestock activities fix risk Priorityareas for protection include areas with high dangersuch as areas under forest exploitation the biospherereserves and populations
The hypothesis was partially fulfilled becausefrom all variables tested only the perimeter of theagricultural areas resulted significant to estimatethe presence of forest fires It is considered that themodels used were appropriate to achieve the posedobjectives The information of this study is useful todecision makers of fire management and ecosystemmanagement in the region
991252End of the English version991252
983152983152983152983158983120983120983120
del fuego en las aacutereas afectadas por el huracaacuten Dean en las aacutereas
tropicales del sureste de Meacutexicordquo elaborado por la UACH A
Ing Viacutector Sosa Cedillo Ing Roberto Martiacutenez Domiacutenguez Dr
J Germaacuten Flores G Dr Juan de D Benavides S y a los Ings o
MC Kuc Uc Gener D Juan O Hernaacutendez L Isaac Mendiola
G Mauricio R Castantildeeda M Rosa L Carrillo Diana Lahoz
Figura 7 Mapa de aacutereas prioritarias de proteccioacutenFigure 7 Map of priority areas for protection
G Karina Coliacuten Y Diana L Saacutenchez V G Elena Islas M y
Elsa Berenice
L ITERATURA CITADA
Arnaldos V J X Navaloacuten N E Pastor F E Planas C
y L Zaacuterate L 2004 Manual de Ingenieriacutea Baacutesica para laPrevencioacuten y Extincioacuten de Incendios Forestales MundiPrensa Madrid 414 p
Brown J K 1974 Handbook for Inventorying Downed WoodyMaterial USDA For Serv Gen Tech Rep INT-16
Challenger A y J Soberoacuten M 2008 Los ecosistemas terrestresVol I Conocimiento actual de la biodiversidad In SarukhaacutenK J Capital Natural de Meacutexico CONABIO Meacutexico DF pp 87-108
Chandler C P Cheney P Thomas L Trabaud and D Williams 1983 Fire in Forestry Vol II Wiley New York298 p
Cochrane M A and M D Schulze 1999 Fire as a recurrentevent in tropical forests of the eastern Amazon effects on
forest structure biomass and species composition Biotropica31 2-16Cochrane M A and K C Ryan 2009 Fire and fire ecology
concepts and principles In Cochrane M A (ed) TropicalFire Ecology Climate Change Land Use and EcosystemDynamics Springer-Praxis Chichester UK pp 25-62
Cooke W H K Grala D Evans and C Collins 2007 Assessment of pre- and post-Katrina fuel conditions asa component of fire potential modeling for SouthernMississippi J For (Dec) 389-397
Cressie N A C 1993 Statistics for Spatial Data Wiley New York 900 p
Cuesta R R M and J Martiacutenez V 2006 Effectiveness ofprotected areas in mitigating fire within their boundariesCase study of Chiapas Meacutexico Cons Biol 20(4) 1074-
1086Environmental Systems Research Institute 1999 Arc View GIS
32 Redland California USAFlores G J G O G Rodriacuteguez Ch M Meleacutendez G y O
G Rosas A 2008 Sitios de muestreo para el monitoreo decombustibles forestales SIMMCOF Centro de InvestigacioacutenRegional del Paciacutefico Centro Campo Experimental Centro Altos de Jalisco INIFAP Folleto Teacutecnico no 1 47 p
Gould W G Gonzaacutelez A T Hudak T Nettleton H and JHollingsworth 2008 Forest structure and downed woodydebris in boreal temperate and tropical forest fragments Ambio 37(7-8) 577-587
Hosmer D W and S Lemeshow 2000 Applied LogisticRegression Wiley New York 392 p
INEGI 2004 Carta de Uso del Suelo y Vegetacioacuten 1250 000Insightful Corporation 2002 S-plus v 8p for WindowsEnterprise Developer Edition Washington USA
Jain T B W A Gould R T Graham D S Pilliod L BLentile and G Gonzaacutelez 2008 A soil burn severity indexfor understanding soil-fire relations in tropical forests Ambio 37(7-8) 563-568
Loacutepez P J M Keyes A Gonzaacutelez E F Cabrera y O Saacutenchez1990 Los incendios de Quintana Roo iquestCataacutestrofe ecoloacutegicao evento perioacutedico Ciencia y Desarrollo 16(91) 43-57
Maeda E E A R Formaggio Y E Shimabukono G F B Arcoverde and M C Hansen 2009 Predicting forest firein the Brazilian Amazon using Modis imagery and artificialneural networks Int J Applied Earth Observation andGeoinformation 11(4) 265-272
Maeda E E G F B Arcoverde P K E Pellikka and Y EShimabukoro 2011 Fire risk assessment in the Brazilian Amazon using Modis imagery and change vector analysis Appl Geography 31(1) 76-84
Muntildeoz R C A E J Trevintildeo G J Veraacutestegui Ch J JimeacutenezP y O A Aguirre C 2005 Desarrollo de un modeloespacial para la evaluacioacuten del peligro de incendios forestalesen la Sierra Madre Oriental de Meacutexico InvestigacionesGeograacuteficas 56 101-117
Myers R K and D H van Lear 1998 Hurricane-fireinteractions in coastal forests of the south a review andhypothesis For Ecol Manag 103 265-276
Neri A C D A Rodriacuteguez T y R Contreras A 2008Inflamabilidad de combustibles forestales en las selvas deCalakmul Campeche Universidad y Ciencia 25(2) 125-132
Pyne S J P L Andrews and R D Laven 1996 Introductionto Wildland Fire 2nd ed Wiley New York 769 p
Ripley B D 1981 Spatial Statistics Wiley New York 252 pRodriacuteguez F C G Vera C F Carrillo A J Chavelas P J C
Escoto P y C Paraguirre L 1989 Evaluacioacuten de dantildeos en lazona afectada por el huracaacuten Gilberto y el incendio ocurridoel presente antildeo CIFAP-Meacutex Reporte Teacutecnico 100 p
Rodriacuteguez T D A H Ramiacuterez M H Tchikoueacute y J SantillaacutenP 2008 Factores que inciden en la siniestralidad de incendios
forestales Ciencia For Meacutex 33(104) 37-58SAS Institute 2002 Statistical Analysis System v 90 for
Microcomputers Cary North Carolina USASuaacuterez M E y E Rivera A 1998 Zooplancton e hidrodinaacutemica
en zonas litorales y arrecifales de Quintana Roo MeacutexicoHidrobioloacutegica 8 19-32
Uriarte M and M Papaik 2007 Hurricane impacts ondynamics structure and carbon sequestration potential offorest ecosystems in southern New England USA Tellus59A 519-528
Van Wagner C E and T L Picket 1985 Equations andFORTRAN program for the Canadian Forest Fire WeatherIndex System Forestry Technical Report 33 CanadianForest Service Ottawa Ontario 18 p
Villa S A B E A Hernaacutendez O y V E Sosa C (eds)1990 Plan de manejo silviacutecola integral de la zona norte deQuintana Roo AMPF A C Meacutexico D F 100 p
MODELAJE DEL PELIGRO DE INCENDIO FORESTAL EN LAS ZONAS AFECTADAS POR EL HURACAacuteN DEAN
595RODRIacuteGUEZ-TREJO et al
forestales a lo largo y ancho del aacuterea afectada y sucarga siacute fue contemplada Muchos iacutendices empleanvariables meteoroloacutegicas pero otros no (Pyne et al 1996) En el presente estudio no se incluyeron dichasvariables pero siacute las relativas a actividades agropecua-rias (43 de las causas de incendio en Meacutexico) Para estimar el peligro de incendio forestal se in-tegra los factores de peligro elegidos en uno o maacutesiacutendices numeacutericos o cualitativos relacionados con lanecesidad de proteccioacuten (Chandler et al 1983) Lainvestigacioacuten sobre estimacioacuten de peligro de incendioen aacutereas tropicales afectadas por huracanes es muy es-casa En el Amazonas Maeda et al (2011) utilizaronanaacutelisis vectorial para estimar el riesgo de incendioforestal con las variables aacutereas agriacutecolas y bosque condiferentes niveles de perturbacioacuten o con variables deuso del suelo y su dinaacutemica de cambio empleando
redes neuronales artificiales (Maeda et al 2009)Para estimar el peligro de incendio en aacutereas templa-das de la Sierra Madre Oriental Meacutexico Muntildeoz etal (2005) integraron variables de carga de combus-tibles forestales meteoroloacutegicas y antroacutepicas usandoanaacutelisis espacial multicriterio En zonas templadas deNueva Inglaterra (EEUU) la elevada carga de com-bustibles acumulada tras el paso de huracanes es elprincipal factor que incrementa el peligro de incen-dio (Uriarte y Papaik 2007) Por lo anterior los objetivos del presente estudiofueron 1) determinar la disposicioacuten espacial y patro-
nes de distribucioacuten de cargas de combustibles foresta-les producto del Huracaacuten Dean 2) evaluar el peligrode incendio y 3) determinar aacutereas de proteccioacuten prio-ritaria y elaborar la cartografiacutea respectiva La hipoacutetesisfue que el peligro de incendio forestal aumenta con lacarga de combustibles forestales y con el nuacutemero deaacutereas agriacutecolas o su superficie o su periacutemetro asiacute comocon la densidad o la longitud de caminos
M ATERIALES Y MEacuteTODOS
Aacuterea de estudio y muestreo de combustibles
El aacuterea de trabajo incluyoacute el centro y sur de Quintana Roo el
este de Campeche y el sur de Yucataacuten (Figura 1) y el muestreo se
hizo al azar por conglomerados en el 2007 Cada conglomerado
estuvo compuesto por tres liacuteneas principales para muestreo de
combustibles lentildeosos seguacuten Brown (1974) orientadas a 0 120
y 240deg de azimut y dos cuadros de 0303 m para hojarasca y
capa de fermentacioacuten (Flores et al 2008)
al (2011) used vector analysis to estimate the forestfire hazard with the agricultural and forest areavariables at different levels of disturbance or land usevariables and its dynamics of change using artificialneuronal networks (Maeda et al 2009) To estimatethe fire hazard in temperate areas of the Sierra MadreOriental Meacutexico Muntildeoz et al (2005) integratedvariables of forest fuel load meteorological andanthropical using multi-criteria spatial analysis Intemperate areas of New England (USA) the highestfuel load accumulated after the passage of hurricanesis the main factor increasing the fire hazard (Uriarteand Papaik 2007) Therefore the objectives of this study were1) to determine the spatial arrangement andpatterns of distribution of forest fuel loads result ofHurricane Dean 2) evaluate the danger of fire and
3) determine priority protection areas and developthe respective mapping The hypothesis was thatthe forest fire danger increases with forest fuelloads and the number of agricultural areas or theirsurface or their perimeter as well as the density orlength of roads
M ATERIALS AND METHODS
Study area and fuel sampling
The study area included the central and southern part of
the state of Quintana Roo eastern Campeche and southern Yucataacuten (Figure 1) and sampling was carried out at random by
conglomerates in 2007 Each conglomerate consisted of three
main lines for sampling of woody fuels according to Brown
(1974) oriented at 0 120 and 240deg azimuth and two squares
of 0303 m for litter and fermentation layer (Flores et al
2008)
The sampling lines were 14 m long and divided into four
segments to measure different types of fuel according to the
timelag classes (TL) of woody fuels 35 m (TL1 h and
TL10 h) 7 m (TL100 h) and 14 m (TL1000 h) Samples
of litter and fermentation layer were collected dried in the
laboratory and their load was calculated Samples were collectedin 165 conglomerates 330 sites for litter and fermentation
layer and 1980 lines for woody fuel The sampling intensity
corresponded to a line for sampling of woody fuels per each
2803 ha The center of each conglomerate was geo-referenced
with a geopositioner (GPS) The sample was distributed over
1 400 000 ha obtaining 81 33 and 41 conglomerates in
areas of high medium and low affected areas plus 10 next to
Carga total de combustibles forestales Nuacutemero de aacutereas agriacutecolas o pecuarias por cuadro de 55 km Aacuterea de aacutereas agriacutecolas o pecuarias por cuadro de 55 km
Periacutemetro de aacutereas agriacutecolas o pecuarias por cuadro de 55 kmDensidad de caminos (nuacutemero de ramales ha 1) por cuadro de 55 km
Longitud de caminos (kmha) por cuadro de 55 km
6 CONAFOR (Comisioacuten Nacional Forestal) 2009 Reporte de incendios forestales CONAFOR Folleto
este caso las estimaciones fueron θ0 435 2= θ1 989 5= α=8 2506 y pseudo-R 2 094 El efecto de tendencia en las
coordenadas fue no significativo α=( )0 84 y debido a esto
tambieacuten se utilizoacute un krigado ordinario para predecir esta va-
riable respuesta El error estaacutendar residual obtenido de la esti-
macioacuten fue 304 unidades de carga total Aunque en ocasiones se realizan particiones del conjunto
de observaciones y con base en eacutestas se hacen predicciones
que permiten la validacioacuten cruzada auacuten hay controversia de
la validez de tales teacutecnicas bajo algunas estructuras de auto-
correlacioacuten (Cressie 1993) Asiacute en este caso se consideraron
criterios suficientes la optimalidad predictiva del krigado y
el ajuste satisfactorio de los semi-varigramas muestrales Las
Figuras 3 y 4 muestran los semi-variogramas estimados
Las estimaciones requeridas se efectuaron usando funciones
escritas por el usuario en el programa S-Plus y usando el moacutedulo
Spatial Statistics V 15 (Insightful Corporation 2002) La sis-
tematizacioacuten de datos de los sitios de muestreo se realizoacute con elSIG Arc View (v 32 Environmental Systems Research Institute
1999) para obtener mapas
R ESULTADOS Y DISCUSIOacuteN
La superficie afectada a distintas intensidades fue1 278 589 ha (alta intensidad) 986 979 ha (media)y 2 788 971 ha (baja) 5 054 539 ha en total La sel-va mediana subperennifolia tuvo 840 620 ha de altaafectacioacuten por su amplia extensioacuten donde el huracaacutencausoacute los mayores impactos en la regioacuten este de la
Peniacutensula de Yucataacuten
case the estimates were θ0 435 2= θ1 989 5= α=8 2506
and pseudo-R 2 094 The effect of trend in the coordinates
was not significant α=( )0 84 and because of this it was also
used an ordinary kriging to predict this response variable The
residual standard error obtained from the estimation was 304
units of total load Although sometimes partitions of the set of observations are
carried out and based on these partitions predictions are made
that allow cross-validation there is still controversy as to the
validity of such techniques in some structures of autocorrelation
(Cressie 1993) So in this case sufficient criteria were considered
the predictive optimality of kriging and the satisfactory
adjustment of the sample semi-variogramas Figures 3 and 4
show the estimated semi-variograms
The required estimations were done using functions written
by the user in the program S-Plus and using the module
Spatial Statistics V 15 (Insightful Corporation 2002) Data
systematization of the sampled sites was performed with the SIG Arc View (v 32 Environmental Systems Research Institute
1999) to obtain maps
R ESULTS AND DISCUSSION
The area affected at different intensities was1 278 589 ha (high intensity) 986 979 ha (mediumintensity) and 2 788 971 ha (low intensity)5 054 539 ha in total The medium semi-evergreentropical forest had 840 620 ha of high damage for its
wide extension where the hurricane cause the greatest
impact in the eastern region of the Yucataacuten peninsula
Figura 4 Semi-variograma estimado para la variable cargatotal
Figure 4 Semi-variogram estimated for the total load variable
Figura 3 Semivariograma estimado para la variable iacutendicede peligro
Figure 3 Semi-variogram estimated for the danger index variable
MODELAJE DEL PELIGRO DE INCENDIO FORESTAL EN LAS ZONAS AFECTADAS POR EL HURACAacuteN DEAN
601RODRIacuteGUEZ-TREJO et al
Carga de combustibles forestales
La categoriacutea de carga maacutes comuacuten fue del intervalo20 a 40 Mg ha 1 (2 200 000 ha 431 de la su-perficie) seguida por las clases de 40 a 60 Mg ha 1 (1 200 000 ha 229 ) y20 Mg ha 1 (1 400 000 ha281 ) (Cuadro 2) Las mayores cargas (60 Mgha 1) se observaron en Quintana Roo en selvas me-dianas (Cuadro 2) en aacutereas de importancia forestal ode conservacioacuten como la Organizacioacuten de Produc-tores Canan karsquoachx y parte de la Reserva Xian Kaan(Figura 5) destacando asiacute la necesidad de protegerlasLa carga media fue 404 Mg ha 1 (maacuteximo 137 ymiacutenimo 109 Mg ha 1) La maacutexima se observoacute enselva mediana subperennifolia y fue menor al maacutexi-mo de 1791 Mg ha 1 referido por CONAFOR etal (2005)[7] en aacutereas afectadas por el Huracaacuten Wilma
en 2005 aunque este uacuteltimo usoacute muestreo selecti-vo Los combustibles lentildeosos con un TR de 1000 hrepresentaron casi 30 de la carga media (11994Mg ha 1) en tanto que el total de los combustibleslentildeosos alcanzoacute casi 64
En bosques tropicales huacutemedos no perturbados247 de la carga correspondioacute a combustibles conTR de 1000 h en tanto que 369 fue hojarascay capa de fermentacioacuten (Gould et al 2008) Es-tas proporciones son semejantes a las halladas en el
Forest fuel load
The most common load category was in therange 20 to 40 Mg ha 1 (2 200 000 ha 431 ofthe surface) followed by classes from 40 to 60 Mgha 1 (1 200 000 ha 229 ) and 20 Mg ha 1 (1400 000 ha 281 ) (Table 2) The higher loads(60 Mg ha 1) were observed in Quintana Rooin medium tropical forests (Table 2) in areas offorest importance or conservation areas such as theOrganization of Producers of Canan karsquoachx and partof the Xian Kaan Reserve (Figure 5) emphasizingthus the need to protect them The average load
was 404 Mg ha 1 (maximum 137 and minimum109 Mg 1) The maximum was observed in a semi-evergreen forest and was less than the maximum of1791 Mg ha 1 referred to by CONAFOR et al
(2005)[7]
in areas affected by Hurricane Wilma in2005 although the latter used selective samplingThe woody fuels with a TL of 1000 h accounted foralmost 30 of the average load (11994 Mg ha 1)
while the total wood fuels reached almost 64 In undisturbed tropical rain forests 247 ofthe load corresponded to fuels with TL of 1000h while 369 was litter and fermentation layer(Gould et al 2008) These percentages are similarto those found in this study The proportion of fuels
Cuadro 2 Superficie (ha) por categoriacutea de carga de combustibles y tipo de vegetacioacuten
Table 2 Area (ha) by category of fuel loads and vegetation type
presente estudio La proporcioacuten de combustibles conTR 1000 h no exhibioacute cambios importantes en losdistintos niveles de afectacioacuten Los promedios de laproporcioacuten de combustibles con TR 1000 h fueron
292 289 y 271 para las intensidades alta mediay baja A su vez la proporcioacuten de hojarasca y capa defermentacioacuten fue 383 390 y 307 con lo quetodos estos combustibles mantienen su proporcioacutena distintos niveles de afectacioacuten aunque su carga siacutecambie (Cuadro 3)
Cargas por tipo de vegetacioacuten
En las zonas de alta afectacioacuten la selva medianasubperennifolia tuvo una carga media de 496 Mgha 1 mayor que en la selva baja subperennifolia
(386 Mg ha 1) La maacutexima carga (137 Mg ha 1)correspondioacute a selva mediana con afectacioacuten alta(Cuadro 3) La carga media entre tipos de vegeta-cioacuten en la zona de alto impacto fue 488 Mg ha 1Respecto a zonas de afectacioacuten media la selva me-diana subcaducifolia (383 Mg ha 1) y la medianasubperennifolia (382 Mg ha 1) superaron a la selvabaja subperennifolia (348 Mg ha 1) En este nivel
with TL 1000 h showed no significant changes inthe different levels of damage The average ratios offuel with TL 1000 h were 292 289 and 271 for high medium and low intensities In turn the
litter and fermentation layer ratio was 383 390and 307 with what all of these fuels maintaintheir ratio to different levels of damage althoughdoes change its load (Table 3)
Loads per vegetation type
In areas of high damage the semi-evergreentropical forest had a medium load of 496 Mgha 1 higher than the low-evergreen tropicalforest (386 Mg ha 1) The maximum load(137 Mg ha 1) corresponded to medium forest
tropical which was highly affected (Table 3) Themedium load between types of vegetation in thearea of high impact was 488 Mg ha 1 Withregard to areas of medium damage the mediumsub-deciduous tropical forest (383 Mg ha 1)and the semi-evergreen tropical forest (382 Mgha 1) exceeded the low semi-evergreen tropicalforest (348 Mg ha 1) In this level of damage the
Figura 5 Mapa de cargas de combustibles forestalesFigure 5 Map of loads of forest fuels
MODELAJE DEL PELIGRO DE INCENDIO FORESTAL EN LAS ZONAS AFECTADAS POR EL HURACAacuteN DEAN
603RODRIacuteGUEZ-TREJO et al
maximum load was 847 Mg ha 1 in the semi-evergreen tropical forest and the average betweentypes of vegetation was 382 Mg ha 1 For areas
with low damage the low semi-evergreen tropicalforest showed the highest average (374 Mg ha 1)followed by the medium semi-evergreen tropicalforest (337 Mg h1) and the medium semi-deciduous tropical forest (162 Mg ha 1) Theaverage load in this level of damage was 295 Mgha 1 Similarly Rodriacuteguez et al (1998) report thatthe load increased in vegetation types with more
biomass as high and medium tropical forests afterthe passage of Hurricane Gilbert The means of 496 382 and 337 Mg ha 1 for thelevels of high to low affected areas in medium semi-evergreen tropical forest (2 700 000 ha affected) arehigher than the loads reported by Gould et al (2008)of 279 Mg ha 1 and 197 Mg ha 1 in rainforestsand seasonal tropical forests both undisturbed forests
Analysis by type of fuels
Based on the estimates (response surfaces) of
forest fuels (not shown) litter and fermentationlayer show their highest values to the northeast andsoutheast of the studied area Of woody materials
with 1 h of TL the highest loads are seen in thesoutheast and east-central sectors of the most affectedarea (east) The distribution of these fine materialsis relevant because according to Pyne et al (1996)control the direction of fire spread Moreover the
Cuadro 3 Cargas de combustibles forestales (Mg ha 1) por nivel de afectacioacuten del huracaacutenTable 3 Forest fuel loads (Mg ha 1) by level of affected areas by hurricane
F firmes P en descomposicioacutenv F solid P in decomposition
de afectacioacuten la carga maacutexima fue 847 Mg ha 1 enselva mediana subperennifolia y la media entre tiposde vegetacioacuten fue 382 Mg ha 1 Para las aacutereas conbaja afectacioacuten la selva baja subperennifolia mostroacuteel mayor promedio (374 Mg ha 1) seguida por lamediana subperennifolia (337 Mg ha 1) y la media-na subcaducifolia (162 Mg ha 1) La carga media eneste nivel de afectacioacuten fue 295 Mg ha 1 Similar-mente Rodriacuteguez et al (1989) refieren que la cargaaumentoacute en tipos de vegetacioacuten con maacutes biomasacomo las selvas altas y medianas luego del paso del
huracaacuten Gilberto Las medias de 496 382 y 337 Mg ha 1 paralos niveles de afectacioacuten alto a bajo en selva medianasubperennifolia (2 700 000 ha afectadas) son supe-riores a las cargas reportadas por Gould et al (2008)de 279 Mg ha 1 y 197 Mg ha 1 en bosques tropi-cales huacutemedos y en los secos ambos no perturbados
Anaacutelisis por clase de combustibles
Con base en las estimaciones (superficies de res-puesta) de los combustibles forestales (no mostra-
das) la hojarasca y la capa de fermentacioacuten exhibensus mayores valores hacia el noreste y el sureste dela zona estudiada De los materiales lentildeosos con 1 hde TR las mayores cargas se aprecian en los sectoressureste y centro-este de la zona de mayor afectacioacuten(este) La distribucioacuten de estos materiales finos esrelevante porque seguacuten Pyne et al (1996) contro-lan la direccioacuten de propagacioacuten del fuego Ademaacutes
el patroacuten y caracteriacutesticas de combustibles como ho- jarasca y capa de fermentacioacuten influyen en la pro-babilidad de incendios subterraacuteneos los que emitenmaacutes partiacuteculas suspendidas a la atmoacutesfera (Cochraney Ryan 2009) La capa de fermentacioacuten tarda maacutesque la hojarasca en iniciar su combustioacuten pero libe-ra maacutes energiacutea y hace maacutes severos los incendios sub-terraacuteneos comparados con los superficiales (Neri etal 2008) Los incendios subterraacuteneos son difiacutecilesde combatir y con frecuencia imparables Los com-bustibles con 10 h de TR tuvieron una tendenciasimilar a los de 1 h de TR La mayor concentracioacutende combustibles con 100 h de TR estaacute en la porcioacutenNE y en la centro-este En anaacutelisis combinado decombustibles de 1-100 h de TR la tendencia de losde 100 h prevalece Hay cargas altas de combustibles lentildeosos con TR
de 1000 h desde la costa hasta los liacutemites de Yucataacuteny Campeche por la peacuterdida de fuerza del huracaacutenCon materiales maacutes pesados como estos uacuteltimos elfuego adquiere mayor intensidad lo que dificulta elcontrol (Pyne et al 1996) ademaacutes cuentan con ma-yor tiempo de residencia Finalmente la carga totalmuestra una tendencia semejante a la anterior Paratodos los combustibles lentildeosos hay picos intercala-dos entre partes maacutes o menos planas u onduladasEste comportamiento y la relativa escasez de com-bustibles con TR de 1 y 10 h al NE y una relativa-mente menor presencia de combustibles con TR de
100 h al SE obedecen a distintos efectos del huracaacutenen regiones con diferentes tipos y proporciones deselvas y usos de suelo
Peligro de incendio forestal
El peligro de incendio fue alto en 2 400 000 ha(46 de la superficie) muy alto en 906 000 ha(17 ) y extremo en 85 923 ha (16 ) En Cam-peche influye maacutes el riesgo de incendio por igni-ciones agropecuarias pero en Quintana Roo haypeligro y riesgo por la acumulacioacuten de combustibles
y la presencia de agostaderos y aacutereas agriacutecolas Con-siderando soacutelo selvas medianas en Quintana Roo1 800 000 ha tuvieron peligro de alto a extremoel peligro es mayor al E (Figura 6) Los vientos delSE dominantes en la primavera (Suaacuterez y Rivera1998) la temporada de incendios implican peligroadicional pues dirigiraacuten los incendios a aacutereas conmaacutes combustibles
pattern and characteristics of fuels such as litterand layer of fermentation influence the likelihoodof underground fires which emit more particulatematter into the atmosphere (Cochrane and Ryan2009) The fermentation layer takes longer thanlitter to start burning but it releases more energyand makes more severe underground fires comparedto surface fires (Neri et al 2008) The undergroundfires are difficult to control and often they areunstoppable Fuels with 10 h of TL had a trendsimilar to the 1 h of TL The highest concentrationof fuels with 100 h of TL is at NE and Central-Eastsections In combined analysis of fuels of TL 1-100 hthe trend of 100 h prevails
There are high loads of woody fuels with TL of1000 h from the coast to the borders of Yucataacutenand Campeche due to the loss of strength of the
hurricane With heavier materials like the latter thefire becomes more intense making it difficult tocontrol (Pyne et al 1996) also they are those thathave longer residence time Finally the total loadshows a similar trend to the previous one For all
woody fuels there are peaks interspersed betweenparts more or less flat or wavy This trend and therelative scarcity of fuels with TR of 1 and 10 h to NEand a relatively smaller presence of fuels with TL of100 h to SE are due to various effects of the hurricanein regions with different types and proportions offorests and land uses
Forest fire danger
The fire danger was high in 2 400 000 ha (46 of the surface) very high in 906 000 ha (17 ) andextreme in 85 923 ha (16 ) In Campeche the riskof fire by agricultural ignitions has more influencebut in Quintana Roo there is danger and risk for theaccumulation of fuels and the presence of rangelandand agricultural areas Considering only mediumtropical forests in Quintana Roo 1 800 000 ha hadhigh to extreme danger the danger is greater to the
East (Figure 6) The prevailing SE winds in spring(Suaacuterez and Rivera 1998) the fire season involveadditional danger because the fires will lead to areas
with more fuels The increase in fuel loading indicates danger notonly per se but also by the reduction in the canopycover which facilitates the drying and combustion ofmaterials brought down by hurricanes (Myers and
MODELAJE DEL PELIGRO DE INCENDIO FORESTAL EN LAS ZONAS AFECTADAS POR EL HURACAacuteN DEAN
605RODRIacuteGUEZ-TREJO et al
El aumento en la carga de combustibles indica pe-ligro no soacutelo per se sino tambieacuten por la reduccioacuten enla cobertura de copas que facilita el secado y la com-bustioacuten de los materiales derribados por huracanes
(Myers y van Lear 1998) En selvas los incendios su-perficiales pueden propiciar incendios subterraacuteneosdependiendo de la profundidad de los materiales or-gaacutenicos (Cochrane y Schulze 1999) entre otros fac-tores lo que genera maacutes severidad al quemar el suelo(Jain et al 2008) Histoacutericamente se han presentado incendios enregiones afectadas por huracanes en el sureste deMeacutexico 1) en las aacutereas afectadas por el huracaacuten Janet(deacutecada de 1950) 2) en1989 hubo incendios en 119233 ha en aacutereas afectadas por el huracaacuten Gilberto(Villa et al 1990) y 3) incendios forestales en 2009
en aacutereas impactadas por el huracaacuten Wilma en 2005 Asiacute la conjugacioacuten de factores como sequiacutea intensarelacionada con fenoacutemenos como el Nintildeo o la Nintildease presenta desde el mismo antildeo o hasta unos cua-tro antildeos despueacutes del paso del huracaacuten propiciandolos incendios forestales ante el continuo y ampliouso y mal uso del fuego en la regioacuten Seguacuten Cookeet al (2007) el paso de cualquier huracaacuten aumenta
van Lear 1998) In tropical forests surface fires cancause underground fires depending on the depthof organic materials (Cochrane and Schulze 1999)among other factors which generates more severity
when burning the soil (Jain et al 2008) Historically fires have been present in regionsaffected by hurricanes in southeastern Meacutexico1) in the affected areas by the hurricane Janet (decade1950) 2) in 1989 there were wildfires in 119 233 ha in areas affected by the Hurricane Gilberto (Villaet al 1990) y 3) forest fires in 2009 in areasimpacted by the Hurricane Wilma in 2005 Thusthe combination of factors such as severe droughtassociated with El Nintildeo or La Nintildea comes from thesame year or until about four years after the passageof the hurricane leading to the forest fires related
to the continued and broad use and misuse of firein the region According to Cooke et al (2007)the passage of any hurricane increases fuels andfire danger such as Katrina which increased from3 to 13 the areas with very high fire danger insouthern Mississippi High loads influences more on severe firesand on a low ecological restoration and forest
Figura 6 Mapa de iacutendice de peligro de incendio forestalFigure 6 Map of forest fire danger index
combustibles y peligro de incendio como Katrinaque incrementoacute de 3 a 13 las aacutereas con muy altopeligro de incendio al sur del Mississippi Las cargas altas repercuten en incendios maacutes seve-ros y en una lenta recuperacioacuten ecoloacutegica y de la pro-duccioacuten forestal asiacute como se favorece el cambio deuso del suelo Rodriacuteguez et al (1989) reportan que88 de los aacuterboles estaban derribados en las aacutereasafectadas por el huracaacuten Gilberto (1988) e incendiosforestales (1989) y 54 en las aacutereas afectadas soacutelopor huracaacuten
Aacutereas prioritarias de proteccioacuten
Estas aacutereas se concentran en Quintana Roo don-de estaacuten las mayores cargas de combustibles ade-maacutes estaacuten representadas por selvas medianas con
aprovechamiento forestal selvas medianas y otrostipos de vegetacioacuten como los humedales en las aacutereasnaturales protegidas de XianKaan Quintana Rooy Calakmul Campeche Hay aacutereas con aprovecha-miento forestal que antes del huracaacuten estaban enbuena condicioacuten y con bajo riesgo de incendio poractividades agropecuarias Sin embargo luego delos embates de los vientos huracanados estas aacutereaspueden degradarse maacutes en caso de incendios fores-tales pues son ecosistemas sensibles al fuego Lasaacutereas prioritarias de proteccioacuten estaacuten divididas enalta (gran acumulacioacuten de combustibles selvas bajo
manejo o de conservacioacuten) media (selvas bajas in-cluso en zonas con alto impacto del huracaacuten) y baja(en Campeche a reserva del riesgo de incendio poractividades agropecuarias) (Figura 7)
CONCLUSIONES
En la regioacuten hay maacutes de 2 millones ha con peligroalto muy alto o extremo de incendio forestal Debi-do a que en la definicioacuten de peligro de incendio setomoacute en cuenta la carga de todos los combustiblesforestales incluidos los combustibles pesados por
su lenta descomposicioacuten y disponibilidad durantela eacutepoca de sequiacutea y al extendido uso agropecuariodel fuego en la regioacuten la zonificacioacuten relativa a pe-ligro de incendio forestal y la de aacutereas prioritariasde atencioacuten estaraacuten vigentes durante varios antildeos
A mayor porte de la vegetacioacuten mayor la carga decombustibles generada como las selvas medianasque ademaacutes tienen la maacutes amplia distribucioacuten entre
production recovery as well as the change ofthe land use is favored Rodriacuteguez et al (1989)reported that 88 of the trees were felled in theareas affected by Hurricane Gilbert (1988) andforest fires (1989) and 54 in areas affected onlyby hurricane
Priority areas for protection
Priority forest areas for protection wereconcentrated in Quintana Roo where the highestloads of fuels are located in addition they arerepresented by rainforests with forest exploitationsemi-evergreen forests and other type of vegetationsuch as wetlands in the natural protected areasof XianKaan Quintana Roo and CalakmulCampeche There are areas with forest exploitation
that before the hurricane were in good conditionand with low risk of fire by agriculture-livestockactivities However after the strike of the hurricane
winds these areas may be more degraded in case offorest fires because they are fire-sensitive ecosystemsPriority areas for protection are divided into highpriority (large accumulation of fuels forests undermanagement or conservation) medium priority (lowtropical forests including areas with high impact ofhurricane) and low priority (in Campeche subject tothe fire risk by agricultural activities) (Figure 7)
CONCLUSIONS
In the region there are over 2 million ha withhigh very high or extreme forest fire danger Due tothe fact that in the definition of fire danger the loadof all forest fuels was taken into account includingthe heavy fuels by their slow decomposition andavailability during the drought season and the
widespread agricultural use of fire in the region thedivision into zones related to the forest fire dangerand the priority areas for protection will be in effectfor several years The higher the size of vegetation
the greatest the load of fuels generated such asmedium tropical forests which also have the widestdistribution among the forests of the area There wasa gradient of affected areas and loads of fuels withthe highest levels to the east and the lowest to the
west as the hurricane decreased its strength The higher level of risk corresponded to theeastern region with high loads and agriculture
MODELAJE DEL PELIGRO DE INCENDIO FORESTAL EN LAS ZONAS AFECTADAS POR EL HURACAacuteN DEAN
607RODRIacuteGUEZ-TREJO et al
las selvas de la zona Hubo un gradiente de afec-tacioacuten y cargas de combustibles con los mayoresniveles al este y los menores al oeste en la medidaen que el huracaacuten disminuyoacute su fuerza
El mayor nivel de peligro correspondioacute a la regioacuteneste con elevadas cargas y uso agropecuario de fuegoHacia el oeste con menores cargas las actividadesagropecuarias imprimen riesgo Las aacutereas prioritariasde proteccioacuten incluyen zonas con altos niveles de pe-ligro como las aacutereas bajo aprovechamiento forestallas reservas de la biosfera y poblaciones La hipoacutetesis se cumplioacute parcialmente pues detodas las variables probadas soacutelo el periacutemetro de lasaacutereas agropecuarias resultoacute significativo para estimarla presencia de incendios forestales Se considera quelos modelos utilizados fueron apropiados para alcan-
zar los objetivos planteados La informacioacuten de este estudio es uacutetil para quie-nes toman decisiones de manejo del fuego y de eco-sistemas en la regioacuten
A GRADECIMIENTOS
A CONAFOR que autorizoacute uso de datos del proyecto ldquoPro-
grama de prevencioacuten y combate de incendios forestales y manejo
livestock use of fire To the west with smaller loadsthe agriculturelivestock activities fix risk Priorityareas for protection include areas with high dangersuch as areas under forest exploitation the biospherereserves and populations
The hypothesis was partially fulfilled becausefrom all variables tested only the perimeter of theagricultural areas resulted significant to estimatethe presence of forest fires It is considered that themodels used were appropriate to achieve the posedobjectives The information of this study is useful todecision makers of fire management and ecosystemmanagement in the region
991252End of the English version991252
983152983152983152983158983120983120983120
del fuego en las aacutereas afectadas por el huracaacuten Dean en las aacutereas
tropicales del sureste de Meacutexicordquo elaborado por la UACH A
Ing Viacutector Sosa Cedillo Ing Roberto Martiacutenez Domiacutenguez Dr
J Germaacuten Flores G Dr Juan de D Benavides S y a los Ings o
MC Kuc Uc Gener D Juan O Hernaacutendez L Isaac Mendiola
G Mauricio R Castantildeeda M Rosa L Carrillo Diana Lahoz
Figura 7 Mapa de aacutereas prioritarias de proteccioacutenFigure 7 Map of priority areas for protection
G Karina Coliacuten Y Diana L Saacutenchez V G Elena Islas M y
Elsa Berenice
L ITERATURA CITADA
Arnaldos V J X Navaloacuten N E Pastor F E Planas C
y L Zaacuterate L 2004 Manual de Ingenieriacutea Baacutesica para laPrevencioacuten y Extincioacuten de Incendios Forestales MundiPrensa Madrid 414 p
Brown J K 1974 Handbook for Inventorying Downed WoodyMaterial USDA For Serv Gen Tech Rep INT-16
Challenger A y J Soberoacuten M 2008 Los ecosistemas terrestresVol I Conocimiento actual de la biodiversidad In SarukhaacutenK J Capital Natural de Meacutexico CONABIO Meacutexico DF pp 87-108
Chandler C P Cheney P Thomas L Trabaud and D Williams 1983 Fire in Forestry Vol II Wiley New York298 p
Cochrane M A and M D Schulze 1999 Fire as a recurrentevent in tropical forests of the eastern Amazon effects on
forest structure biomass and species composition Biotropica31 2-16Cochrane M A and K C Ryan 2009 Fire and fire ecology
concepts and principles In Cochrane M A (ed) TropicalFire Ecology Climate Change Land Use and EcosystemDynamics Springer-Praxis Chichester UK pp 25-62
Cooke W H K Grala D Evans and C Collins 2007 Assessment of pre- and post-Katrina fuel conditions asa component of fire potential modeling for SouthernMississippi J For (Dec) 389-397
Cressie N A C 1993 Statistics for Spatial Data Wiley New York 900 p
Cuesta R R M and J Martiacutenez V 2006 Effectiveness ofprotected areas in mitigating fire within their boundariesCase study of Chiapas Meacutexico Cons Biol 20(4) 1074-
1086Environmental Systems Research Institute 1999 Arc View GIS
32 Redland California USAFlores G J G O G Rodriacuteguez Ch M Meleacutendez G y O
G Rosas A 2008 Sitios de muestreo para el monitoreo decombustibles forestales SIMMCOF Centro de InvestigacioacutenRegional del Paciacutefico Centro Campo Experimental Centro Altos de Jalisco INIFAP Folleto Teacutecnico no 1 47 p
Gould W G Gonzaacutelez A T Hudak T Nettleton H and JHollingsworth 2008 Forest structure and downed woodydebris in boreal temperate and tropical forest fragments Ambio 37(7-8) 577-587
Hosmer D W and S Lemeshow 2000 Applied LogisticRegression Wiley New York 392 p
INEGI 2004 Carta de Uso del Suelo y Vegetacioacuten 1250 000Insightful Corporation 2002 S-plus v 8p for WindowsEnterprise Developer Edition Washington USA
Jain T B W A Gould R T Graham D S Pilliod L BLentile and G Gonzaacutelez 2008 A soil burn severity indexfor understanding soil-fire relations in tropical forests Ambio 37(7-8) 563-568
Loacutepez P J M Keyes A Gonzaacutelez E F Cabrera y O Saacutenchez1990 Los incendios de Quintana Roo iquestCataacutestrofe ecoloacutegicao evento perioacutedico Ciencia y Desarrollo 16(91) 43-57
Maeda E E A R Formaggio Y E Shimabukono G F B Arcoverde and M C Hansen 2009 Predicting forest firein the Brazilian Amazon using Modis imagery and artificialneural networks Int J Applied Earth Observation andGeoinformation 11(4) 265-272
Maeda E E G F B Arcoverde P K E Pellikka and Y EShimabukoro 2011 Fire risk assessment in the Brazilian Amazon using Modis imagery and change vector analysis Appl Geography 31(1) 76-84
Muntildeoz R C A E J Trevintildeo G J Veraacutestegui Ch J JimeacutenezP y O A Aguirre C 2005 Desarrollo de un modeloespacial para la evaluacioacuten del peligro de incendios forestalesen la Sierra Madre Oriental de Meacutexico InvestigacionesGeograacuteficas 56 101-117
Myers R K and D H van Lear 1998 Hurricane-fireinteractions in coastal forests of the south a review andhypothesis For Ecol Manag 103 265-276
Neri A C D A Rodriacuteguez T y R Contreras A 2008Inflamabilidad de combustibles forestales en las selvas deCalakmul Campeche Universidad y Ciencia 25(2) 125-132
Pyne S J P L Andrews and R D Laven 1996 Introductionto Wildland Fire 2nd ed Wiley New York 769 p
Ripley B D 1981 Spatial Statistics Wiley New York 252 pRodriacuteguez F C G Vera C F Carrillo A J Chavelas P J C
Escoto P y C Paraguirre L 1989 Evaluacioacuten de dantildeos en lazona afectada por el huracaacuten Gilberto y el incendio ocurridoel presente antildeo CIFAP-Meacutex Reporte Teacutecnico 100 p
Rodriacuteguez T D A H Ramiacuterez M H Tchikoueacute y J SantillaacutenP 2008 Factores que inciden en la siniestralidad de incendios
forestales Ciencia For Meacutex 33(104) 37-58SAS Institute 2002 Statistical Analysis System v 90 for
Microcomputers Cary North Carolina USASuaacuterez M E y E Rivera A 1998 Zooplancton e hidrodinaacutemica
en zonas litorales y arrecifales de Quintana Roo MeacutexicoHidrobioloacutegica 8 19-32
Uriarte M and M Papaik 2007 Hurricane impacts ondynamics structure and carbon sequestration potential offorest ecosystems in southern New England USA Tellus59A 519-528
Van Wagner C E and T L Picket 1985 Equations andFORTRAN program for the Canadian Forest Fire WeatherIndex System Forestry Technical Report 33 CanadianForest Service Ottawa Ontario 18 p
Villa S A B E A Hernaacutendez O y V E Sosa C (eds)1990 Plan de manejo silviacutecola integral de la zona norte deQuintana Roo AMPF A C Meacutexico D F 100 p
MODELAJE DEL PELIGRO DE INCENDIO FORESTAL EN LAS ZONAS AFECTADAS POR EL HURACAacuteN DEAN
601RODRIacuteGUEZ-TREJO et al
Carga de combustibles forestales
La categoriacutea de carga maacutes comuacuten fue del intervalo20 a 40 Mg ha 1 (2 200 000 ha 431 de la su-perficie) seguida por las clases de 40 a 60 Mg ha 1 (1 200 000 ha 229 ) y20 Mg ha 1 (1 400 000 ha281 ) (Cuadro 2) Las mayores cargas (60 Mgha 1) se observaron en Quintana Roo en selvas me-dianas (Cuadro 2) en aacutereas de importancia forestal ode conservacioacuten como la Organizacioacuten de Produc-tores Canan karsquoachx y parte de la Reserva Xian Kaan(Figura 5) destacando asiacute la necesidad de protegerlasLa carga media fue 404 Mg ha 1 (maacuteximo 137 ymiacutenimo 109 Mg ha 1) La maacutexima se observoacute enselva mediana subperennifolia y fue menor al maacutexi-mo de 1791 Mg ha 1 referido por CONAFOR etal (2005)[7] en aacutereas afectadas por el Huracaacuten Wilma
en 2005 aunque este uacuteltimo usoacute muestreo selecti-vo Los combustibles lentildeosos con un TR de 1000 hrepresentaron casi 30 de la carga media (11994Mg ha 1) en tanto que el total de los combustibleslentildeosos alcanzoacute casi 64
En bosques tropicales huacutemedos no perturbados247 de la carga correspondioacute a combustibles conTR de 1000 h en tanto que 369 fue hojarascay capa de fermentacioacuten (Gould et al 2008) Es-tas proporciones son semejantes a las halladas en el
Forest fuel load
The most common load category was in therange 20 to 40 Mg ha 1 (2 200 000 ha 431 ofthe surface) followed by classes from 40 to 60 Mgha 1 (1 200 000 ha 229 ) and 20 Mg ha 1 (1400 000 ha 281 ) (Table 2) The higher loads(60 Mg ha 1) were observed in Quintana Rooin medium tropical forests (Table 2) in areas offorest importance or conservation areas such as theOrganization of Producers of Canan karsquoachx and partof the Xian Kaan Reserve (Figure 5) emphasizingthus the need to protect them The average load
was 404 Mg ha 1 (maximum 137 and minimum109 Mg 1) The maximum was observed in a semi-evergreen forest and was less than the maximum of1791 Mg ha 1 referred to by CONAFOR et al
(2005)[7]
in areas affected by Hurricane Wilma in2005 although the latter used selective samplingThe woody fuels with a TL of 1000 h accounted foralmost 30 of the average load (11994 Mg ha 1)
while the total wood fuels reached almost 64 In undisturbed tropical rain forests 247 ofthe load corresponded to fuels with TL of 1000h while 369 was litter and fermentation layer(Gould et al 2008) These percentages are similarto those found in this study The proportion of fuels
Cuadro 2 Superficie (ha) por categoriacutea de carga de combustibles y tipo de vegetacioacuten
Table 2 Area (ha) by category of fuel loads and vegetation type
presente estudio La proporcioacuten de combustibles conTR 1000 h no exhibioacute cambios importantes en losdistintos niveles de afectacioacuten Los promedios de laproporcioacuten de combustibles con TR 1000 h fueron
292 289 y 271 para las intensidades alta mediay baja A su vez la proporcioacuten de hojarasca y capa defermentacioacuten fue 383 390 y 307 con lo quetodos estos combustibles mantienen su proporcioacutena distintos niveles de afectacioacuten aunque su carga siacutecambie (Cuadro 3)
Cargas por tipo de vegetacioacuten
En las zonas de alta afectacioacuten la selva medianasubperennifolia tuvo una carga media de 496 Mgha 1 mayor que en la selva baja subperennifolia
(386 Mg ha 1) La maacutexima carga (137 Mg ha 1)correspondioacute a selva mediana con afectacioacuten alta(Cuadro 3) La carga media entre tipos de vegeta-cioacuten en la zona de alto impacto fue 488 Mg ha 1Respecto a zonas de afectacioacuten media la selva me-diana subcaducifolia (383 Mg ha 1) y la medianasubperennifolia (382 Mg ha 1) superaron a la selvabaja subperennifolia (348 Mg ha 1) En este nivel
with TL 1000 h showed no significant changes inthe different levels of damage The average ratios offuel with TL 1000 h were 292 289 and 271 for high medium and low intensities In turn the
litter and fermentation layer ratio was 383 390and 307 with what all of these fuels maintaintheir ratio to different levels of damage althoughdoes change its load (Table 3)
Loads per vegetation type
In areas of high damage the semi-evergreentropical forest had a medium load of 496 Mgha 1 higher than the low-evergreen tropicalforest (386 Mg ha 1) The maximum load(137 Mg ha 1) corresponded to medium forest
tropical which was highly affected (Table 3) Themedium load between types of vegetation in thearea of high impact was 488 Mg ha 1 Withregard to areas of medium damage the mediumsub-deciduous tropical forest (383 Mg ha 1)and the semi-evergreen tropical forest (382 Mgha 1) exceeded the low semi-evergreen tropicalforest (348 Mg ha 1) In this level of damage the
Figura 5 Mapa de cargas de combustibles forestalesFigure 5 Map of loads of forest fuels
MODELAJE DEL PELIGRO DE INCENDIO FORESTAL EN LAS ZONAS AFECTADAS POR EL HURACAacuteN DEAN
603RODRIacuteGUEZ-TREJO et al
maximum load was 847 Mg ha 1 in the semi-evergreen tropical forest and the average betweentypes of vegetation was 382 Mg ha 1 For areas
with low damage the low semi-evergreen tropicalforest showed the highest average (374 Mg ha 1)followed by the medium semi-evergreen tropicalforest (337 Mg h1) and the medium semi-deciduous tropical forest (162 Mg ha 1) Theaverage load in this level of damage was 295 Mgha 1 Similarly Rodriacuteguez et al (1998) report thatthe load increased in vegetation types with more
biomass as high and medium tropical forests afterthe passage of Hurricane Gilbert The means of 496 382 and 337 Mg ha 1 for thelevels of high to low affected areas in medium semi-evergreen tropical forest (2 700 000 ha affected) arehigher than the loads reported by Gould et al (2008)of 279 Mg ha 1 and 197 Mg ha 1 in rainforestsand seasonal tropical forests both undisturbed forests
Analysis by type of fuels
Based on the estimates (response surfaces) of
forest fuels (not shown) litter and fermentationlayer show their highest values to the northeast andsoutheast of the studied area Of woody materials
with 1 h of TL the highest loads are seen in thesoutheast and east-central sectors of the most affectedarea (east) The distribution of these fine materialsis relevant because according to Pyne et al (1996)control the direction of fire spread Moreover the
Cuadro 3 Cargas de combustibles forestales (Mg ha 1) por nivel de afectacioacuten del huracaacutenTable 3 Forest fuel loads (Mg ha 1) by level of affected areas by hurricane
F firmes P en descomposicioacutenv F solid P in decomposition
de afectacioacuten la carga maacutexima fue 847 Mg ha 1 enselva mediana subperennifolia y la media entre tiposde vegetacioacuten fue 382 Mg ha 1 Para las aacutereas conbaja afectacioacuten la selva baja subperennifolia mostroacuteel mayor promedio (374 Mg ha 1) seguida por lamediana subperennifolia (337 Mg ha 1) y la media-na subcaducifolia (162 Mg ha 1) La carga media eneste nivel de afectacioacuten fue 295 Mg ha 1 Similar-mente Rodriacuteguez et al (1989) refieren que la cargaaumentoacute en tipos de vegetacioacuten con maacutes biomasacomo las selvas altas y medianas luego del paso del
huracaacuten Gilberto Las medias de 496 382 y 337 Mg ha 1 paralos niveles de afectacioacuten alto a bajo en selva medianasubperennifolia (2 700 000 ha afectadas) son supe-riores a las cargas reportadas por Gould et al (2008)de 279 Mg ha 1 y 197 Mg ha 1 en bosques tropi-cales huacutemedos y en los secos ambos no perturbados
Anaacutelisis por clase de combustibles
Con base en las estimaciones (superficies de res-puesta) de los combustibles forestales (no mostra-
das) la hojarasca y la capa de fermentacioacuten exhibensus mayores valores hacia el noreste y el sureste dela zona estudiada De los materiales lentildeosos con 1 hde TR las mayores cargas se aprecian en los sectoressureste y centro-este de la zona de mayor afectacioacuten(este) La distribucioacuten de estos materiales finos esrelevante porque seguacuten Pyne et al (1996) contro-lan la direccioacuten de propagacioacuten del fuego Ademaacutes
el patroacuten y caracteriacutesticas de combustibles como ho- jarasca y capa de fermentacioacuten influyen en la pro-babilidad de incendios subterraacuteneos los que emitenmaacutes partiacuteculas suspendidas a la atmoacutesfera (Cochraney Ryan 2009) La capa de fermentacioacuten tarda maacutesque la hojarasca en iniciar su combustioacuten pero libe-ra maacutes energiacutea y hace maacutes severos los incendios sub-terraacuteneos comparados con los superficiales (Neri etal 2008) Los incendios subterraacuteneos son difiacutecilesde combatir y con frecuencia imparables Los com-bustibles con 10 h de TR tuvieron una tendenciasimilar a los de 1 h de TR La mayor concentracioacutende combustibles con 100 h de TR estaacute en la porcioacutenNE y en la centro-este En anaacutelisis combinado decombustibles de 1-100 h de TR la tendencia de losde 100 h prevalece Hay cargas altas de combustibles lentildeosos con TR
de 1000 h desde la costa hasta los liacutemites de Yucataacuteny Campeche por la peacuterdida de fuerza del huracaacutenCon materiales maacutes pesados como estos uacuteltimos elfuego adquiere mayor intensidad lo que dificulta elcontrol (Pyne et al 1996) ademaacutes cuentan con ma-yor tiempo de residencia Finalmente la carga totalmuestra una tendencia semejante a la anterior Paratodos los combustibles lentildeosos hay picos intercala-dos entre partes maacutes o menos planas u onduladasEste comportamiento y la relativa escasez de com-bustibles con TR de 1 y 10 h al NE y una relativa-mente menor presencia de combustibles con TR de
100 h al SE obedecen a distintos efectos del huracaacutenen regiones con diferentes tipos y proporciones deselvas y usos de suelo
Peligro de incendio forestal
El peligro de incendio fue alto en 2 400 000 ha(46 de la superficie) muy alto en 906 000 ha(17 ) y extremo en 85 923 ha (16 ) En Cam-peche influye maacutes el riesgo de incendio por igni-ciones agropecuarias pero en Quintana Roo haypeligro y riesgo por la acumulacioacuten de combustibles
y la presencia de agostaderos y aacutereas agriacutecolas Con-siderando soacutelo selvas medianas en Quintana Roo1 800 000 ha tuvieron peligro de alto a extremoel peligro es mayor al E (Figura 6) Los vientos delSE dominantes en la primavera (Suaacuterez y Rivera1998) la temporada de incendios implican peligroadicional pues dirigiraacuten los incendios a aacutereas conmaacutes combustibles
pattern and characteristics of fuels such as litterand layer of fermentation influence the likelihoodof underground fires which emit more particulatematter into the atmosphere (Cochrane and Ryan2009) The fermentation layer takes longer thanlitter to start burning but it releases more energyand makes more severe underground fires comparedto surface fires (Neri et al 2008) The undergroundfires are difficult to control and often they areunstoppable Fuels with 10 h of TL had a trendsimilar to the 1 h of TL The highest concentrationof fuels with 100 h of TL is at NE and Central-Eastsections In combined analysis of fuels of TL 1-100 hthe trend of 100 h prevails
There are high loads of woody fuels with TL of1000 h from the coast to the borders of Yucataacutenand Campeche due to the loss of strength of the
hurricane With heavier materials like the latter thefire becomes more intense making it difficult tocontrol (Pyne et al 1996) also they are those thathave longer residence time Finally the total loadshows a similar trend to the previous one For all
woody fuels there are peaks interspersed betweenparts more or less flat or wavy This trend and therelative scarcity of fuels with TR of 1 and 10 h to NEand a relatively smaller presence of fuels with TL of100 h to SE are due to various effects of the hurricanein regions with different types and proportions offorests and land uses
Forest fire danger
The fire danger was high in 2 400 000 ha (46 of the surface) very high in 906 000 ha (17 ) andextreme in 85 923 ha (16 ) In Campeche the riskof fire by agricultural ignitions has more influencebut in Quintana Roo there is danger and risk for theaccumulation of fuels and the presence of rangelandand agricultural areas Considering only mediumtropical forests in Quintana Roo 1 800 000 ha hadhigh to extreme danger the danger is greater to the
East (Figure 6) The prevailing SE winds in spring(Suaacuterez and Rivera 1998) the fire season involveadditional danger because the fires will lead to areas
with more fuels The increase in fuel loading indicates danger notonly per se but also by the reduction in the canopycover which facilitates the drying and combustion ofmaterials brought down by hurricanes (Myers and
MODELAJE DEL PELIGRO DE INCENDIO FORESTAL EN LAS ZONAS AFECTADAS POR EL HURACAacuteN DEAN
605RODRIacuteGUEZ-TREJO et al
El aumento en la carga de combustibles indica pe-ligro no soacutelo per se sino tambieacuten por la reduccioacuten enla cobertura de copas que facilita el secado y la com-bustioacuten de los materiales derribados por huracanes
(Myers y van Lear 1998) En selvas los incendios su-perficiales pueden propiciar incendios subterraacuteneosdependiendo de la profundidad de los materiales or-gaacutenicos (Cochrane y Schulze 1999) entre otros fac-tores lo que genera maacutes severidad al quemar el suelo(Jain et al 2008) Histoacutericamente se han presentado incendios enregiones afectadas por huracanes en el sureste deMeacutexico 1) en las aacutereas afectadas por el huracaacuten Janet(deacutecada de 1950) 2) en1989 hubo incendios en 119233 ha en aacutereas afectadas por el huracaacuten Gilberto(Villa et al 1990) y 3) incendios forestales en 2009
en aacutereas impactadas por el huracaacuten Wilma en 2005 Asiacute la conjugacioacuten de factores como sequiacutea intensarelacionada con fenoacutemenos como el Nintildeo o la Nintildease presenta desde el mismo antildeo o hasta unos cua-tro antildeos despueacutes del paso del huracaacuten propiciandolos incendios forestales ante el continuo y ampliouso y mal uso del fuego en la regioacuten Seguacuten Cookeet al (2007) el paso de cualquier huracaacuten aumenta
van Lear 1998) In tropical forests surface fires cancause underground fires depending on the depthof organic materials (Cochrane and Schulze 1999)among other factors which generates more severity
when burning the soil (Jain et al 2008) Historically fires have been present in regionsaffected by hurricanes in southeastern Meacutexico1) in the affected areas by the hurricane Janet (decade1950) 2) in 1989 there were wildfires in 119 233 ha in areas affected by the Hurricane Gilberto (Villaet al 1990) y 3) forest fires in 2009 in areasimpacted by the Hurricane Wilma in 2005 Thusthe combination of factors such as severe droughtassociated with El Nintildeo or La Nintildea comes from thesame year or until about four years after the passageof the hurricane leading to the forest fires related
to the continued and broad use and misuse of firein the region According to Cooke et al (2007)the passage of any hurricane increases fuels andfire danger such as Katrina which increased from3 to 13 the areas with very high fire danger insouthern Mississippi High loads influences more on severe firesand on a low ecological restoration and forest
Figura 6 Mapa de iacutendice de peligro de incendio forestalFigure 6 Map of forest fire danger index
combustibles y peligro de incendio como Katrinaque incrementoacute de 3 a 13 las aacutereas con muy altopeligro de incendio al sur del Mississippi Las cargas altas repercuten en incendios maacutes seve-ros y en una lenta recuperacioacuten ecoloacutegica y de la pro-duccioacuten forestal asiacute como se favorece el cambio deuso del suelo Rodriacuteguez et al (1989) reportan que88 de los aacuterboles estaban derribados en las aacutereasafectadas por el huracaacuten Gilberto (1988) e incendiosforestales (1989) y 54 en las aacutereas afectadas soacutelopor huracaacuten
Aacutereas prioritarias de proteccioacuten
Estas aacutereas se concentran en Quintana Roo don-de estaacuten las mayores cargas de combustibles ade-maacutes estaacuten representadas por selvas medianas con
aprovechamiento forestal selvas medianas y otrostipos de vegetacioacuten como los humedales en las aacutereasnaturales protegidas de XianKaan Quintana Rooy Calakmul Campeche Hay aacutereas con aprovecha-miento forestal que antes del huracaacuten estaban enbuena condicioacuten y con bajo riesgo de incendio poractividades agropecuarias Sin embargo luego delos embates de los vientos huracanados estas aacutereaspueden degradarse maacutes en caso de incendios fores-tales pues son ecosistemas sensibles al fuego Lasaacutereas prioritarias de proteccioacuten estaacuten divididas enalta (gran acumulacioacuten de combustibles selvas bajo
manejo o de conservacioacuten) media (selvas bajas in-cluso en zonas con alto impacto del huracaacuten) y baja(en Campeche a reserva del riesgo de incendio poractividades agropecuarias) (Figura 7)
CONCLUSIONES
En la regioacuten hay maacutes de 2 millones ha con peligroalto muy alto o extremo de incendio forestal Debi-do a que en la definicioacuten de peligro de incendio setomoacute en cuenta la carga de todos los combustiblesforestales incluidos los combustibles pesados por
su lenta descomposicioacuten y disponibilidad durantela eacutepoca de sequiacutea y al extendido uso agropecuariodel fuego en la regioacuten la zonificacioacuten relativa a pe-ligro de incendio forestal y la de aacutereas prioritariasde atencioacuten estaraacuten vigentes durante varios antildeos
A mayor porte de la vegetacioacuten mayor la carga decombustibles generada como las selvas medianasque ademaacutes tienen la maacutes amplia distribucioacuten entre
production recovery as well as the change ofthe land use is favored Rodriacuteguez et al (1989)reported that 88 of the trees were felled in theareas affected by Hurricane Gilbert (1988) andforest fires (1989) and 54 in areas affected onlyby hurricane
Priority areas for protection
Priority forest areas for protection wereconcentrated in Quintana Roo where the highestloads of fuels are located in addition they arerepresented by rainforests with forest exploitationsemi-evergreen forests and other type of vegetationsuch as wetlands in the natural protected areasof XianKaan Quintana Roo and CalakmulCampeche There are areas with forest exploitation
that before the hurricane were in good conditionand with low risk of fire by agriculture-livestockactivities However after the strike of the hurricane
winds these areas may be more degraded in case offorest fires because they are fire-sensitive ecosystemsPriority areas for protection are divided into highpriority (large accumulation of fuels forests undermanagement or conservation) medium priority (lowtropical forests including areas with high impact ofhurricane) and low priority (in Campeche subject tothe fire risk by agricultural activities) (Figure 7)
CONCLUSIONS
In the region there are over 2 million ha withhigh very high or extreme forest fire danger Due tothe fact that in the definition of fire danger the loadof all forest fuels was taken into account includingthe heavy fuels by their slow decomposition andavailability during the drought season and the
widespread agricultural use of fire in the region thedivision into zones related to the forest fire dangerand the priority areas for protection will be in effectfor several years The higher the size of vegetation
the greatest the load of fuels generated such asmedium tropical forests which also have the widestdistribution among the forests of the area There wasa gradient of affected areas and loads of fuels withthe highest levels to the east and the lowest to the
west as the hurricane decreased its strength The higher level of risk corresponded to theeastern region with high loads and agriculture
MODELAJE DEL PELIGRO DE INCENDIO FORESTAL EN LAS ZONAS AFECTADAS POR EL HURACAacuteN DEAN
607RODRIacuteGUEZ-TREJO et al
las selvas de la zona Hubo un gradiente de afec-tacioacuten y cargas de combustibles con los mayoresniveles al este y los menores al oeste en la medidaen que el huracaacuten disminuyoacute su fuerza
El mayor nivel de peligro correspondioacute a la regioacuteneste con elevadas cargas y uso agropecuario de fuegoHacia el oeste con menores cargas las actividadesagropecuarias imprimen riesgo Las aacutereas prioritariasde proteccioacuten incluyen zonas con altos niveles de pe-ligro como las aacutereas bajo aprovechamiento forestallas reservas de la biosfera y poblaciones La hipoacutetesis se cumplioacute parcialmente pues detodas las variables probadas soacutelo el periacutemetro de lasaacutereas agropecuarias resultoacute significativo para estimarla presencia de incendios forestales Se considera quelos modelos utilizados fueron apropiados para alcan-
zar los objetivos planteados La informacioacuten de este estudio es uacutetil para quie-nes toman decisiones de manejo del fuego y de eco-sistemas en la regioacuten
A GRADECIMIENTOS
A CONAFOR que autorizoacute uso de datos del proyecto ldquoPro-
grama de prevencioacuten y combate de incendios forestales y manejo
livestock use of fire To the west with smaller loadsthe agriculturelivestock activities fix risk Priorityareas for protection include areas with high dangersuch as areas under forest exploitation the biospherereserves and populations
The hypothesis was partially fulfilled becausefrom all variables tested only the perimeter of theagricultural areas resulted significant to estimatethe presence of forest fires It is considered that themodels used were appropriate to achieve the posedobjectives The information of this study is useful todecision makers of fire management and ecosystemmanagement in the region
991252End of the English version991252
983152983152983152983158983120983120983120
del fuego en las aacutereas afectadas por el huracaacuten Dean en las aacutereas
tropicales del sureste de Meacutexicordquo elaborado por la UACH A
Ing Viacutector Sosa Cedillo Ing Roberto Martiacutenez Domiacutenguez Dr
J Germaacuten Flores G Dr Juan de D Benavides S y a los Ings o
MC Kuc Uc Gener D Juan O Hernaacutendez L Isaac Mendiola
G Mauricio R Castantildeeda M Rosa L Carrillo Diana Lahoz
Figura 7 Mapa de aacutereas prioritarias de proteccioacutenFigure 7 Map of priority areas for protection
G Karina Coliacuten Y Diana L Saacutenchez V G Elena Islas M y
Elsa Berenice
L ITERATURA CITADA
Arnaldos V J X Navaloacuten N E Pastor F E Planas C
y L Zaacuterate L 2004 Manual de Ingenieriacutea Baacutesica para laPrevencioacuten y Extincioacuten de Incendios Forestales MundiPrensa Madrid 414 p
Brown J K 1974 Handbook for Inventorying Downed WoodyMaterial USDA For Serv Gen Tech Rep INT-16
Challenger A y J Soberoacuten M 2008 Los ecosistemas terrestresVol I Conocimiento actual de la biodiversidad In SarukhaacutenK J Capital Natural de Meacutexico CONABIO Meacutexico DF pp 87-108
Chandler C P Cheney P Thomas L Trabaud and D Williams 1983 Fire in Forestry Vol II Wiley New York298 p
Cochrane M A and M D Schulze 1999 Fire as a recurrentevent in tropical forests of the eastern Amazon effects on
forest structure biomass and species composition Biotropica31 2-16Cochrane M A and K C Ryan 2009 Fire and fire ecology
concepts and principles In Cochrane M A (ed) TropicalFire Ecology Climate Change Land Use and EcosystemDynamics Springer-Praxis Chichester UK pp 25-62
Cooke W H K Grala D Evans and C Collins 2007 Assessment of pre- and post-Katrina fuel conditions asa component of fire potential modeling for SouthernMississippi J For (Dec) 389-397
Cressie N A C 1993 Statistics for Spatial Data Wiley New York 900 p
Cuesta R R M and J Martiacutenez V 2006 Effectiveness ofprotected areas in mitigating fire within their boundariesCase study of Chiapas Meacutexico Cons Biol 20(4) 1074-
1086Environmental Systems Research Institute 1999 Arc View GIS
32 Redland California USAFlores G J G O G Rodriacuteguez Ch M Meleacutendez G y O
G Rosas A 2008 Sitios de muestreo para el monitoreo decombustibles forestales SIMMCOF Centro de InvestigacioacutenRegional del Paciacutefico Centro Campo Experimental Centro Altos de Jalisco INIFAP Folleto Teacutecnico no 1 47 p
Gould W G Gonzaacutelez A T Hudak T Nettleton H and JHollingsworth 2008 Forest structure and downed woodydebris in boreal temperate and tropical forest fragments Ambio 37(7-8) 577-587
Hosmer D W and S Lemeshow 2000 Applied LogisticRegression Wiley New York 392 p
INEGI 2004 Carta de Uso del Suelo y Vegetacioacuten 1250 000Insightful Corporation 2002 S-plus v 8p for WindowsEnterprise Developer Edition Washington USA
Jain T B W A Gould R T Graham D S Pilliod L BLentile and G Gonzaacutelez 2008 A soil burn severity indexfor understanding soil-fire relations in tropical forests Ambio 37(7-8) 563-568
Loacutepez P J M Keyes A Gonzaacutelez E F Cabrera y O Saacutenchez1990 Los incendios de Quintana Roo iquestCataacutestrofe ecoloacutegicao evento perioacutedico Ciencia y Desarrollo 16(91) 43-57
Maeda E E A R Formaggio Y E Shimabukono G F B Arcoverde and M C Hansen 2009 Predicting forest firein the Brazilian Amazon using Modis imagery and artificialneural networks Int J Applied Earth Observation andGeoinformation 11(4) 265-272
Maeda E E G F B Arcoverde P K E Pellikka and Y EShimabukoro 2011 Fire risk assessment in the Brazilian Amazon using Modis imagery and change vector analysis Appl Geography 31(1) 76-84
Muntildeoz R C A E J Trevintildeo G J Veraacutestegui Ch J JimeacutenezP y O A Aguirre C 2005 Desarrollo de un modeloespacial para la evaluacioacuten del peligro de incendios forestalesen la Sierra Madre Oriental de Meacutexico InvestigacionesGeograacuteficas 56 101-117
Myers R K and D H van Lear 1998 Hurricane-fireinteractions in coastal forests of the south a review andhypothesis For Ecol Manag 103 265-276
Neri A C D A Rodriacuteguez T y R Contreras A 2008Inflamabilidad de combustibles forestales en las selvas deCalakmul Campeche Universidad y Ciencia 25(2) 125-132
Pyne S J P L Andrews and R D Laven 1996 Introductionto Wildland Fire 2nd ed Wiley New York 769 p
Ripley B D 1981 Spatial Statistics Wiley New York 252 pRodriacuteguez F C G Vera C F Carrillo A J Chavelas P J C
Escoto P y C Paraguirre L 1989 Evaluacioacuten de dantildeos en lazona afectada por el huracaacuten Gilberto y el incendio ocurridoel presente antildeo CIFAP-Meacutex Reporte Teacutecnico 100 p
Rodriacuteguez T D A H Ramiacuterez M H Tchikoueacute y J SantillaacutenP 2008 Factores que inciden en la siniestralidad de incendios
forestales Ciencia For Meacutex 33(104) 37-58SAS Institute 2002 Statistical Analysis System v 90 for
Microcomputers Cary North Carolina USASuaacuterez M E y E Rivera A 1998 Zooplancton e hidrodinaacutemica
en zonas litorales y arrecifales de Quintana Roo MeacutexicoHidrobioloacutegica 8 19-32
Uriarte M and M Papaik 2007 Hurricane impacts ondynamics structure and carbon sequestration potential offorest ecosystems in southern New England USA Tellus59A 519-528
Van Wagner C E and T L Picket 1985 Equations andFORTRAN program for the Canadian Forest Fire WeatherIndex System Forestry Technical Report 33 CanadianForest Service Ottawa Ontario 18 p
Villa S A B E A Hernaacutendez O y V E Sosa C (eds)1990 Plan de manejo silviacutecola integral de la zona norte deQuintana Roo AMPF A C Meacutexico D F 100 p
MODELAJE DEL PELIGRO DE INCENDIO FORESTAL EN LAS ZONAS AFECTADAS POR EL HURACAacuteN DEAN
603RODRIacuteGUEZ-TREJO et al
maximum load was 847 Mg ha 1 in the semi-evergreen tropical forest and the average betweentypes of vegetation was 382 Mg ha 1 For areas
with low damage the low semi-evergreen tropicalforest showed the highest average (374 Mg ha 1)followed by the medium semi-evergreen tropicalforest (337 Mg h1) and the medium semi-deciduous tropical forest (162 Mg ha 1) Theaverage load in this level of damage was 295 Mgha 1 Similarly Rodriacuteguez et al (1998) report thatthe load increased in vegetation types with more
biomass as high and medium tropical forests afterthe passage of Hurricane Gilbert The means of 496 382 and 337 Mg ha 1 for thelevels of high to low affected areas in medium semi-evergreen tropical forest (2 700 000 ha affected) arehigher than the loads reported by Gould et al (2008)of 279 Mg ha 1 and 197 Mg ha 1 in rainforestsand seasonal tropical forests both undisturbed forests
Analysis by type of fuels
Based on the estimates (response surfaces) of
forest fuels (not shown) litter and fermentationlayer show their highest values to the northeast andsoutheast of the studied area Of woody materials
with 1 h of TL the highest loads are seen in thesoutheast and east-central sectors of the most affectedarea (east) The distribution of these fine materialsis relevant because according to Pyne et al (1996)control the direction of fire spread Moreover the
Cuadro 3 Cargas de combustibles forestales (Mg ha 1) por nivel de afectacioacuten del huracaacutenTable 3 Forest fuel loads (Mg ha 1) by level of affected areas by hurricane
F firmes P en descomposicioacutenv F solid P in decomposition
de afectacioacuten la carga maacutexima fue 847 Mg ha 1 enselva mediana subperennifolia y la media entre tiposde vegetacioacuten fue 382 Mg ha 1 Para las aacutereas conbaja afectacioacuten la selva baja subperennifolia mostroacuteel mayor promedio (374 Mg ha 1) seguida por lamediana subperennifolia (337 Mg ha 1) y la media-na subcaducifolia (162 Mg ha 1) La carga media eneste nivel de afectacioacuten fue 295 Mg ha 1 Similar-mente Rodriacuteguez et al (1989) refieren que la cargaaumentoacute en tipos de vegetacioacuten con maacutes biomasacomo las selvas altas y medianas luego del paso del
huracaacuten Gilberto Las medias de 496 382 y 337 Mg ha 1 paralos niveles de afectacioacuten alto a bajo en selva medianasubperennifolia (2 700 000 ha afectadas) son supe-riores a las cargas reportadas por Gould et al (2008)de 279 Mg ha 1 y 197 Mg ha 1 en bosques tropi-cales huacutemedos y en los secos ambos no perturbados
Anaacutelisis por clase de combustibles
Con base en las estimaciones (superficies de res-puesta) de los combustibles forestales (no mostra-
das) la hojarasca y la capa de fermentacioacuten exhibensus mayores valores hacia el noreste y el sureste dela zona estudiada De los materiales lentildeosos con 1 hde TR las mayores cargas se aprecian en los sectoressureste y centro-este de la zona de mayor afectacioacuten(este) La distribucioacuten de estos materiales finos esrelevante porque seguacuten Pyne et al (1996) contro-lan la direccioacuten de propagacioacuten del fuego Ademaacutes
el patroacuten y caracteriacutesticas de combustibles como ho- jarasca y capa de fermentacioacuten influyen en la pro-babilidad de incendios subterraacuteneos los que emitenmaacutes partiacuteculas suspendidas a la atmoacutesfera (Cochraney Ryan 2009) La capa de fermentacioacuten tarda maacutesque la hojarasca en iniciar su combustioacuten pero libe-ra maacutes energiacutea y hace maacutes severos los incendios sub-terraacuteneos comparados con los superficiales (Neri etal 2008) Los incendios subterraacuteneos son difiacutecilesde combatir y con frecuencia imparables Los com-bustibles con 10 h de TR tuvieron una tendenciasimilar a los de 1 h de TR La mayor concentracioacutende combustibles con 100 h de TR estaacute en la porcioacutenNE y en la centro-este En anaacutelisis combinado decombustibles de 1-100 h de TR la tendencia de losde 100 h prevalece Hay cargas altas de combustibles lentildeosos con TR
de 1000 h desde la costa hasta los liacutemites de Yucataacuteny Campeche por la peacuterdida de fuerza del huracaacutenCon materiales maacutes pesados como estos uacuteltimos elfuego adquiere mayor intensidad lo que dificulta elcontrol (Pyne et al 1996) ademaacutes cuentan con ma-yor tiempo de residencia Finalmente la carga totalmuestra una tendencia semejante a la anterior Paratodos los combustibles lentildeosos hay picos intercala-dos entre partes maacutes o menos planas u onduladasEste comportamiento y la relativa escasez de com-bustibles con TR de 1 y 10 h al NE y una relativa-mente menor presencia de combustibles con TR de
100 h al SE obedecen a distintos efectos del huracaacutenen regiones con diferentes tipos y proporciones deselvas y usos de suelo
Peligro de incendio forestal
El peligro de incendio fue alto en 2 400 000 ha(46 de la superficie) muy alto en 906 000 ha(17 ) y extremo en 85 923 ha (16 ) En Cam-peche influye maacutes el riesgo de incendio por igni-ciones agropecuarias pero en Quintana Roo haypeligro y riesgo por la acumulacioacuten de combustibles
y la presencia de agostaderos y aacutereas agriacutecolas Con-siderando soacutelo selvas medianas en Quintana Roo1 800 000 ha tuvieron peligro de alto a extremoel peligro es mayor al E (Figura 6) Los vientos delSE dominantes en la primavera (Suaacuterez y Rivera1998) la temporada de incendios implican peligroadicional pues dirigiraacuten los incendios a aacutereas conmaacutes combustibles
pattern and characteristics of fuels such as litterand layer of fermentation influence the likelihoodof underground fires which emit more particulatematter into the atmosphere (Cochrane and Ryan2009) The fermentation layer takes longer thanlitter to start burning but it releases more energyand makes more severe underground fires comparedto surface fires (Neri et al 2008) The undergroundfires are difficult to control and often they areunstoppable Fuels with 10 h of TL had a trendsimilar to the 1 h of TL The highest concentrationof fuels with 100 h of TL is at NE and Central-Eastsections In combined analysis of fuels of TL 1-100 hthe trend of 100 h prevails
There are high loads of woody fuels with TL of1000 h from the coast to the borders of Yucataacutenand Campeche due to the loss of strength of the
hurricane With heavier materials like the latter thefire becomes more intense making it difficult tocontrol (Pyne et al 1996) also they are those thathave longer residence time Finally the total loadshows a similar trend to the previous one For all
woody fuels there are peaks interspersed betweenparts more or less flat or wavy This trend and therelative scarcity of fuels with TR of 1 and 10 h to NEand a relatively smaller presence of fuels with TL of100 h to SE are due to various effects of the hurricanein regions with different types and proportions offorests and land uses
Forest fire danger
The fire danger was high in 2 400 000 ha (46 of the surface) very high in 906 000 ha (17 ) andextreme in 85 923 ha (16 ) In Campeche the riskof fire by agricultural ignitions has more influencebut in Quintana Roo there is danger and risk for theaccumulation of fuels and the presence of rangelandand agricultural areas Considering only mediumtropical forests in Quintana Roo 1 800 000 ha hadhigh to extreme danger the danger is greater to the
East (Figure 6) The prevailing SE winds in spring(Suaacuterez and Rivera 1998) the fire season involveadditional danger because the fires will lead to areas
with more fuels The increase in fuel loading indicates danger notonly per se but also by the reduction in the canopycover which facilitates the drying and combustion ofmaterials brought down by hurricanes (Myers and
MODELAJE DEL PELIGRO DE INCENDIO FORESTAL EN LAS ZONAS AFECTADAS POR EL HURACAacuteN DEAN
605RODRIacuteGUEZ-TREJO et al
El aumento en la carga de combustibles indica pe-ligro no soacutelo per se sino tambieacuten por la reduccioacuten enla cobertura de copas que facilita el secado y la com-bustioacuten de los materiales derribados por huracanes
(Myers y van Lear 1998) En selvas los incendios su-perficiales pueden propiciar incendios subterraacuteneosdependiendo de la profundidad de los materiales or-gaacutenicos (Cochrane y Schulze 1999) entre otros fac-tores lo que genera maacutes severidad al quemar el suelo(Jain et al 2008) Histoacutericamente se han presentado incendios enregiones afectadas por huracanes en el sureste deMeacutexico 1) en las aacutereas afectadas por el huracaacuten Janet(deacutecada de 1950) 2) en1989 hubo incendios en 119233 ha en aacutereas afectadas por el huracaacuten Gilberto(Villa et al 1990) y 3) incendios forestales en 2009
en aacutereas impactadas por el huracaacuten Wilma en 2005 Asiacute la conjugacioacuten de factores como sequiacutea intensarelacionada con fenoacutemenos como el Nintildeo o la Nintildease presenta desde el mismo antildeo o hasta unos cua-tro antildeos despueacutes del paso del huracaacuten propiciandolos incendios forestales ante el continuo y ampliouso y mal uso del fuego en la regioacuten Seguacuten Cookeet al (2007) el paso de cualquier huracaacuten aumenta
van Lear 1998) In tropical forests surface fires cancause underground fires depending on the depthof organic materials (Cochrane and Schulze 1999)among other factors which generates more severity
when burning the soil (Jain et al 2008) Historically fires have been present in regionsaffected by hurricanes in southeastern Meacutexico1) in the affected areas by the hurricane Janet (decade1950) 2) in 1989 there were wildfires in 119 233 ha in areas affected by the Hurricane Gilberto (Villaet al 1990) y 3) forest fires in 2009 in areasimpacted by the Hurricane Wilma in 2005 Thusthe combination of factors such as severe droughtassociated with El Nintildeo or La Nintildea comes from thesame year or until about four years after the passageof the hurricane leading to the forest fires related
to the continued and broad use and misuse of firein the region According to Cooke et al (2007)the passage of any hurricane increases fuels andfire danger such as Katrina which increased from3 to 13 the areas with very high fire danger insouthern Mississippi High loads influences more on severe firesand on a low ecological restoration and forest
Figura 6 Mapa de iacutendice de peligro de incendio forestalFigure 6 Map of forest fire danger index
combustibles y peligro de incendio como Katrinaque incrementoacute de 3 a 13 las aacutereas con muy altopeligro de incendio al sur del Mississippi Las cargas altas repercuten en incendios maacutes seve-ros y en una lenta recuperacioacuten ecoloacutegica y de la pro-duccioacuten forestal asiacute como se favorece el cambio deuso del suelo Rodriacuteguez et al (1989) reportan que88 de los aacuterboles estaban derribados en las aacutereasafectadas por el huracaacuten Gilberto (1988) e incendiosforestales (1989) y 54 en las aacutereas afectadas soacutelopor huracaacuten
Aacutereas prioritarias de proteccioacuten
Estas aacutereas se concentran en Quintana Roo don-de estaacuten las mayores cargas de combustibles ade-maacutes estaacuten representadas por selvas medianas con
aprovechamiento forestal selvas medianas y otrostipos de vegetacioacuten como los humedales en las aacutereasnaturales protegidas de XianKaan Quintana Rooy Calakmul Campeche Hay aacutereas con aprovecha-miento forestal que antes del huracaacuten estaban enbuena condicioacuten y con bajo riesgo de incendio poractividades agropecuarias Sin embargo luego delos embates de los vientos huracanados estas aacutereaspueden degradarse maacutes en caso de incendios fores-tales pues son ecosistemas sensibles al fuego Lasaacutereas prioritarias de proteccioacuten estaacuten divididas enalta (gran acumulacioacuten de combustibles selvas bajo
manejo o de conservacioacuten) media (selvas bajas in-cluso en zonas con alto impacto del huracaacuten) y baja(en Campeche a reserva del riesgo de incendio poractividades agropecuarias) (Figura 7)
CONCLUSIONES
En la regioacuten hay maacutes de 2 millones ha con peligroalto muy alto o extremo de incendio forestal Debi-do a que en la definicioacuten de peligro de incendio setomoacute en cuenta la carga de todos los combustiblesforestales incluidos los combustibles pesados por
su lenta descomposicioacuten y disponibilidad durantela eacutepoca de sequiacutea y al extendido uso agropecuariodel fuego en la regioacuten la zonificacioacuten relativa a pe-ligro de incendio forestal y la de aacutereas prioritariasde atencioacuten estaraacuten vigentes durante varios antildeos
A mayor porte de la vegetacioacuten mayor la carga decombustibles generada como las selvas medianasque ademaacutes tienen la maacutes amplia distribucioacuten entre
production recovery as well as the change ofthe land use is favored Rodriacuteguez et al (1989)reported that 88 of the trees were felled in theareas affected by Hurricane Gilbert (1988) andforest fires (1989) and 54 in areas affected onlyby hurricane
Priority areas for protection
Priority forest areas for protection wereconcentrated in Quintana Roo where the highestloads of fuels are located in addition they arerepresented by rainforests with forest exploitationsemi-evergreen forests and other type of vegetationsuch as wetlands in the natural protected areasof XianKaan Quintana Roo and CalakmulCampeche There are areas with forest exploitation
that before the hurricane were in good conditionand with low risk of fire by agriculture-livestockactivities However after the strike of the hurricane
winds these areas may be more degraded in case offorest fires because they are fire-sensitive ecosystemsPriority areas for protection are divided into highpriority (large accumulation of fuels forests undermanagement or conservation) medium priority (lowtropical forests including areas with high impact ofhurricane) and low priority (in Campeche subject tothe fire risk by agricultural activities) (Figure 7)
CONCLUSIONS
In the region there are over 2 million ha withhigh very high or extreme forest fire danger Due tothe fact that in the definition of fire danger the loadof all forest fuels was taken into account includingthe heavy fuels by their slow decomposition andavailability during the drought season and the
widespread agricultural use of fire in the region thedivision into zones related to the forest fire dangerand the priority areas for protection will be in effectfor several years The higher the size of vegetation
the greatest the load of fuels generated such asmedium tropical forests which also have the widestdistribution among the forests of the area There wasa gradient of affected areas and loads of fuels withthe highest levels to the east and the lowest to the
west as the hurricane decreased its strength The higher level of risk corresponded to theeastern region with high loads and agriculture
MODELAJE DEL PELIGRO DE INCENDIO FORESTAL EN LAS ZONAS AFECTADAS POR EL HURACAacuteN DEAN
607RODRIacuteGUEZ-TREJO et al
las selvas de la zona Hubo un gradiente de afec-tacioacuten y cargas de combustibles con los mayoresniveles al este y los menores al oeste en la medidaen que el huracaacuten disminuyoacute su fuerza
El mayor nivel de peligro correspondioacute a la regioacuteneste con elevadas cargas y uso agropecuario de fuegoHacia el oeste con menores cargas las actividadesagropecuarias imprimen riesgo Las aacutereas prioritariasde proteccioacuten incluyen zonas con altos niveles de pe-ligro como las aacutereas bajo aprovechamiento forestallas reservas de la biosfera y poblaciones La hipoacutetesis se cumplioacute parcialmente pues detodas las variables probadas soacutelo el periacutemetro de lasaacutereas agropecuarias resultoacute significativo para estimarla presencia de incendios forestales Se considera quelos modelos utilizados fueron apropiados para alcan-
zar los objetivos planteados La informacioacuten de este estudio es uacutetil para quie-nes toman decisiones de manejo del fuego y de eco-sistemas en la regioacuten
A GRADECIMIENTOS
A CONAFOR que autorizoacute uso de datos del proyecto ldquoPro-
grama de prevencioacuten y combate de incendios forestales y manejo
livestock use of fire To the west with smaller loadsthe agriculturelivestock activities fix risk Priorityareas for protection include areas with high dangersuch as areas under forest exploitation the biospherereserves and populations
The hypothesis was partially fulfilled becausefrom all variables tested only the perimeter of theagricultural areas resulted significant to estimatethe presence of forest fires It is considered that themodels used were appropriate to achieve the posedobjectives The information of this study is useful todecision makers of fire management and ecosystemmanagement in the region
991252End of the English version991252
983152983152983152983158983120983120983120
del fuego en las aacutereas afectadas por el huracaacuten Dean en las aacutereas
tropicales del sureste de Meacutexicordquo elaborado por la UACH A
Ing Viacutector Sosa Cedillo Ing Roberto Martiacutenez Domiacutenguez Dr
J Germaacuten Flores G Dr Juan de D Benavides S y a los Ings o
MC Kuc Uc Gener D Juan O Hernaacutendez L Isaac Mendiola
G Mauricio R Castantildeeda M Rosa L Carrillo Diana Lahoz
Figura 7 Mapa de aacutereas prioritarias de proteccioacutenFigure 7 Map of priority areas for protection
G Karina Coliacuten Y Diana L Saacutenchez V G Elena Islas M y
Elsa Berenice
L ITERATURA CITADA
Arnaldos V J X Navaloacuten N E Pastor F E Planas C
y L Zaacuterate L 2004 Manual de Ingenieriacutea Baacutesica para laPrevencioacuten y Extincioacuten de Incendios Forestales MundiPrensa Madrid 414 p
Brown J K 1974 Handbook for Inventorying Downed WoodyMaterial USDA For Serv Gen Tech Rep INT-16
Challenger A y J Soberoacuten M 2008 Los ecosistemas terrestresVol I Conocimiento actual de la biodiversidad In SarukhaacutenK J Capital Natural de Meacutexico CONABIO Meacutexico DF pp 87-108
Chandler C P Cheney P Thomas L Trabaud and D Williams 1983 Fire in Forestry Vol II Wiley New York298 p
Cochrane M A and M D Schulze 1999 Fire as a recurrentevent in tropical forests of the eastern Amazon effects on
forest structure biomass and species composition Biotropica31 2-16Cochrane M A and K C Ryan 2009 Fire and fire ecology
concepts and principles In Cochrane M A (ed) TropicalFire Ecology Climate Change Land Use and EcosystemDynamics Springer-Praxis Chichester UK pp 25-62
Cooke W H K Grala D Evans and C Collins 2007 Assessment of pre- and post-Katrina fuel conditions asa component of fire potential modeling for SouthernMississippi J For (Dec) 389-397
Cressie N A C 1993 Statistics for Spatial Data Wiley New York 900 p
Cuesta R R M and J Martiacutenez V 2006 Effectiveness ofprotected areas in mitigating fire within their boundariesCase study of Chiapas Meacutexico Cons Biol 20(4) 1074-
1086Environmental Systems Research Institute 1999 Arc View GIS
32 Redland California USAFlores G J G O G Rodriacuteguez Ch M Meleacutendez G y O
G Rosas A 2008 Sitios de muestreo para el monitoreo decombustibles forestales SIMMCOF Centro de InvestigacioacutenRegional del Paciacutefico Centro Campo Experimental Centro Altos de Jalisco INIFAP Folleto Teacutecnico no 1 47 p
Gould W G Gonzaacutelez A T Hudak T Nettleton H and JHollingsworth 2008 Forest structure and downed woodydebris in boreal temperate and tropical forest fragments Ambio 37(7-8) 577-587
Hosmer D W and S Lemeshow 2000 Applied LogisticRegression Wiley New York 392 p
INEGI 2004 Carta de Uso del Suelo y Vegetacioacuten 1250 000Insightful Corporation 2002 S-plus v 8p for WindowsEnterprise Developer Edition Washington USA
Jain T B W A Gould R T Graham D S Pilliod L BLentile and G Gonzaacutelez 2008 A soil burn severity indexfor understanding soil-fire relations in tropical forests Ambio 37(7-8) 563-568
Loacutepez P J M Keyes A Gonzaacutelez E F Cabrera y O Saacutenchez1990 Los incendios de Quintana Roo iquestCataacutestrofe ecoloacutegicao evento perioacutedico Ciencia y Desarrollo 16(91) 43-57
Maeda E E A R Formaggio Y E Shimabukono G F B Arcoverde and M C Hansen 2009 Predicting forest firein the Brazilian Amazon using Modis imagery and artificialneural networks Int J Applied Earth Observation andGeoinformation 11(4) 265-272
Maeda E E G F B Arcoverde P K E Pellikka and Y EShimabukoro 2011 Fire risk assessment in the Brazilian Amazon using Modis imagery and change vector analysis Appl Geography 31(1) 76-84
Muntildeoz R C A E J Trevintildeo G J Veraacutestegui Ch J JimeacutenezP y O A Aguirre C 2005 Desarrollo de un modeloespacial para la evaluacioacuten del peligro de incendios forestalesen la Sierra Madre Oriental de Meacutexico InvestigacionesGeograacuteficas 56 101-117
Myers R K and D H van Lear 1998 Hurricane-fireinteractions in coastal forests of the south a review andhypothesis For Ecol Manag 103 265-276
Neri A C D A Rodriacuteguez T y R Contreras A 2008Inflamabilidad de combustibles forestales en las selvas deCalakmul Campeche Universidad y Ciencia 25(2) 125-132
Pyne S J P L Andrews and R D Laven 1996 Introductionto Wildland Fire 2nd ed Wiley New York 769 p
Ripley B D 1981 Spatial Statistics Wiley New York 252 pRodriacuteguez F C G Vera C F Carrillo A J Chavelas P J C
Escoto P y C Paraguirre L 1989 Evaluacioacuten de dantildeos en lazona afectada por el huracaacuten Gilberto y el incendio ocurridoel presente antildeo CIFAP-Meacutex Reporte Teacutecnico 100 p
Rodriacuteguez T D A H Ramiacuterez M H Tchikoueacute y J SantillaacutenP 2008 Factores que inciden en la siniestralidad de incendios
forestales Ciencia For Meacutex 33(104) 37-58SAS Institute 2002 Statistical Analysis System v 90 for
Microcomputers Cary North Carolina USASuaacuterez M E y E Rivera A 1998 Zooplancton e hidrodinaacutemica
en zonas litorales y arrecifales de Quintana Roo MeacutexicoHidrobioloacutegica 8 19-32
Uriarte M and M Papaik 2007 Hurricane impacts ondynamics structure and carbon sequestration potential offorest ecosystems in southern New England USA Tellus59A 519-528
Van Wagner C E and T L Picket 1985 Equations andFORTRAN program for the Canadian Forest Fire WeatherIndex System Forestry Technical Report 33 CanadianForest Service Ottawa Ontario 18 p
Villa S A B E A Hernaacutendez O y V E Sosa C (eds)1990 Plan de manejo silviacutecola integral de la zona norte deQuintana Roo AMPF A C Meacutexico D F 100 p
MODELAJE DEL PELIGRO DE INCENDIO FORESTAL EN LAS ZONAS AFECTADAS POR EL HURACAacuteN DEAN
605RODRIacuteGUEZ-TREJO et al
El aumento en la carga de combustibles indica pe-ligro no soacutelo per se sino tambieacuten por la reduccioacuten enla cobertura de copas que facilita el secado y la com-bustioacuten de los materiales derribados por huracanes
(Myers y van Lear 1998) En selvas los incendios su-perficiales pueden propiciar incendios subterraacuteneosdependiendo de la profundidad de los materiales or-gaacutenicos (Cochrane y Schulze 1999) entre otros fac-tores lo que genera maacutes severidad al quemar el suelo(Jain et al 2008) Histoacutericamente se han presentado incendios enregiones afectadas por huracanes en el sureste deMeacutexico 1) en las aacutereas afectadas por el huracaacuten Janet(deacutecada de 1950) 2) en1989 hubo incendios en 119233 ha en aacutereas afectadas por el huracaacuten Gilberto(Villa et al 1990) y 3) incendios forestales en 2009
en aacutereas impactadas por el huracaacuten Wilma en 2005 Asiacute la conjugacioacuten de factores como sequiacutea intensarelacionada con fenoacutemenos como el Nintildeo o la Nintildease presenta desde el mismo antildeo o hasta unos cua-tro antildeos despueacutes del paso del huracaacuten propiciandolos incendios forestales ante el continuo y ampliouso y mal uso del fuego en la regioacuten Seguacuten Cookeet al (2007) el paso de cualquier huracaacuten aumenta
van Lear 1998) In tropical forests surface fires cancause underground fires depending on the depthof organic materials (Cochrane and Schulze 1999)among other factors which generates more severity
when burning the soil (Jain et al 2008) Historically fires have been present in regionsaffected by hurricanes in southeastern Meacutexico1) in the affected areas by the hurricane Janet (decade1950) 2) in 1989 there were wildfires in 119 233 ha in areas affected by the Hurricane Gilberto (Villaet al 1990) y 3) forest fires in 2009 in areasimpacted by the Hurricane Wilma in 2005 Thusthe combination of factors such as severe droughtassociated with El Nintildeo or La Nintildea comes from thesame year or until about four years after the passageof the hurricane leading to the forest fires related
to the continued and broad use and misuse of firein the region According to Cooke et al (2007)the passage of any hurricane increases fuels andfire danger such as Katrina which increased from3 to 13 the areas with very high fire danger insouthern Mississippi High loads influences more on severe firesand on a low ecological restoration and forest
Figura 6 Mapa de iacutendice de peligro de incendio forestalFigure 6 Map of forest fire danger index
combustibles y peligro de incendio como Katrinaque incrementoacute de 3 a 13 las aacutereas con muy altopeligro de incendio al sur del Mississippi Las cargas altas repercuten en incendios maacutes seve-ros y en una lenta recuperacioacuten ecoloacutegica y de la pro-duccioacuten forestal asiacute como se favorece el cambio deuso del suelo Rodriacuteguez et al (1989) reportan que88 de los aacuterboles estaban derribados en las aacutereasafectadas por el huracaacuten Gilberto (1988) e incendiosforestales (1989) y 54 en las aacutereas afectadas soacutelopor huracaacuten
Aacutereas prioritarias de proteccioacuten
Estas aacutereas se concentran en Quintana Roo don-de estaacuten las mayores cargas de combustibles ade-maacutes estaacuten representadas por selvas medianas con
aprovechamiento forestal selvas medianas y otrostipos de vegetacioacuten como los humedales en las aacutereasnaturales protegidas de XianKaan Quintana Rooy Calakmul Campeche Hay aacutereas con aprovecha-miento forestal que antes del huracaacuten estaban enbuena condicioacuten y con bajo riesgo de incendio poractividades agropecuarias Sin embargo luego delos embates de los vientos huracanados estas aacutereaspueden degradarse maacutes en caso de incendios fores-tales pues son ecosistemas sensibles al fuego Lasaacutereas prioritarias de proteccioacuten estaacuten divididas enalta (gran acumulacioacuten de combustibles selvas bajo
manejo o de conservacioacuten) media (selvas bajas in-cluso en zonas con alto impacto del huracaacuten) y baja(en Campeche a reserva del riesgo de incendio poractividades agropecuarias) (Figura 7)
CONCLUSIONES
En la regioacuten hay maacutes de 2 millones ha con peligroalto muy alto o extremo de incendio forestal Debi-do a que en la definicioacuten de peligro de incendio setomoacute en cuenta la carga de todos los combustiblesforestales incluidos los combustibles pesados por
su lenta descomposicioacuten y disponibilidad durantela eacutepoca de sequiacutea y al extendido uso agropecuariodel fuego en la regioacuten la zonificacioacuten relativa a pe-ligro de incendio forestal y la de aacutereas prioritariasde atencioacuten estaraacuten vigentes durante varios antildeos
A mayor porte de la vegetacioacuten mayor la carga decombustibles generada como las selvas medianasque ademaacutes tienen la maacutes amplia distribucioacuten entre
production recovery as well as the change ofthe land use is favored Rodriacuteguez et al (1989)reported that 88 of the trees were felled in theareas affected by Hurricane Gilbert (1988) andforest fires (1989) and 54 in areas affected onlyby hurricane
Priority areas for protection
Priority forest areas for protection wereconcentrated in Quintana Roo where the highestloads of fuels are located in addition they arerepresented by rainforests with forest exploitationsemi-evergreen forests and other type of vegetationsuch as wetlands in the natural protected areasof XianKaan Quintana Roo and CalakmulCampeche There are areas with forest exploitation
that before the hurricane were in good conditionand with low risk of fire by agriculture-livestockactivities However after the strike of the hurricane
winds these areas may be more degraded in case offorest fires because they are fire-sensitive ecosystemsPriority areas for protection are divided into highpriority (large accumulation of fuels forests undermanagement or conservation) medium priority (lowtropical forests including areas with high impact ofhurricane) and low priority (in Campeche subject tothe fire risk by agricultural activities) (Figure 7)
CONCLUSIONS
In the region there are over 2 million ha withhigh very high or extreme forest fire danger Due tothe fact that in the definition of fire danger the loadof all forest fuels was taken into account includingthe heavy fuels by their slow decomposition andavailability during the drought season and the
widespread agricultural use of fire in the region thedivision into zones related to the forest fire dangerand the priority areas for protection will be in effectfor several years The higher the size of vegetation
the greatest the load of fuels generated such asmedium tropical forests which also have the widestdistribution among the forests of the area There wasa gradient of affected areas and loads of fuels withthe highest levels to the east and the lowest to the
west as the hurricane decreased its strength The higher level of risk corresponded to theeastern region with high loads and agriculture
MODELAJE DEL PELIGRO DE INCENDIO FORESTAL EN LAS ZONAS AFECTADAS POR EL HURACAacuteN DEAN
607RODRIacuteGUEZ-TREJO et al
las selvas de la zona Hubo un gradiente de afec-tacioacuten y cargas de combustibles con los mayoresniveles al este y los menores al oeste en la medidaen que el huracaacuten disminuyoacute su fuerza
El mayor nivel de peligro correspondioacute a la regioacuteneste con elevadas cargas y uso agropecuario de fuegoHacia el oeste con menores cargas las actividadesagropecuarias imprimen riesgo Las aacutereas prioritariasde proteccioacuten incluyen zonas con altos niveles de pe-ligro como las aacutereas bajo aprovechamiento forestallas reservas de la biosfera y poblaciones La hipoacutetesis se cumplioacute parcialmente pues detodas las variables probadas soacutelo el periacutemetro de lasaacutereas agropecuarias resultoacute significativo para estimarla presencia de incendios forestales Se considera quelos modelos utilizados fueron apropiados para alcan-
zar los objetivos planteados La informacioacuten de este estudio es uacutetil para quie-nes toman decisiones de manejo del fuego y de eco-sistemas en la regioacuten
A GRADECIMIENTOS
A CONAFOR que autorizoacute uso de datos del proyecto ldquoPro-
grama de prevencioacuten y combate de incendios forestales y manejo
livestock use of fire To the west with smaller loadsthe agriculturelivestock activities fix risk Priorityareas for protection include areas with high dangersuch as areas under forest exploitation the biospherereserves and populations
The hypothesis was partially fulfilled becausefrom all variables tested only the perimeter of theagricultural areas resulted significant to estimatethe presence of forest fires It is considered that themodels used were appropriate to achieve the posedobjectives The information of this study is useful todecision makers of fire management and ecosystemmanagement in the region
991252End of the English version991252
983152983152983152983158983120983120983120
del fuego en las aacutereas afectadas por el huracaacuten Dean en las aacutereas
tropicales del sureste de Meacutexicordquo elaborado por la UACH A
Ing Viacutector Sosa Cedillo Ing Roberto Martiacutenez Domiacutenguez Dr
J Germaacuten Flores G Dr Juan de D Benavides S y a los Ings o
MC Kuc Uc Gener D Juan O Hernaacutendez L Isaac Mendiola
G Mauricio R Castantildeeda M Rosa L Carrillo Diana Lahoz
Figura 7 Mapa de aacutereas prioritarias de proteccioacutenFigure 7 Map of priority areas for protection
G Karina Coliacuten Y Diana L Saacutenchez V G Elena Islas M y
Elsa Berenice
L ITERATURA CITADA
Arnaldos V J X Navaloacuten N E Pastor F E Planas C
y L Zaacuterate L 2004 Manual de Ingenieriacutea Baacutesica para laPrevencioacuten y Extincioacuten de Incendios Forestales MundiPrensa Madrid 414 p
Brown J K 1974 Handbook for Inventorying Downed WoodyMaterial USDA For Serv Gen Tech Rep INT-16
Challenger A y J Soberoacuten M 2008 Los ecosistemas terrestresVol I Conocimiento actual de la biodiversidad In SarukhaacutenK J Capital Natural de Meacutexico CONABIO Meacutexico DF pp 87-108
Chandler C P Cheney P Thomas L Trabaud and D Williams 1983 Fire in Forestry Vol II Wiley New York298 p
Cochrane M A and M D Schulze 1999 Fire as a recurrentevent in tropical forests of the eastern Amazon effects on
forest structure biomass and species composition Biotropica31 2-16Cochrane M A and K C Ryan 2009 Fire and fire ecology
concepts and principles In Cochrane M A (ed) TropicalFire Ecology Climate Change Land Use and EcosystemDynamics Springer-Praxis Chichester UK pp 25-62
Cooke W H K Grala D Evans and C Collins 2007 Assessment of pre- and post-Katrina fuel conditions asa component of fire potential modeling for SouthernMississippi J For (Dec) 389-397
Cressie N A C 1993 Statistics for Spatial Data Wiley New York 900 p
Cuesta R R M and J Martiacutenez V 2006 Effectiveness ofprotected areas in mitigating fire within their boundariesCase study of Chiapas Meacutexico Cons Biol 20(4) 1074-
1086Environmental Systems Research Institute 1999 Arc View GIS
32 Redland California USAFlores G J G O G Rodriacuteguez Ch M Meleacutendez G y O
G Rosas A 2008 Sitios de muestreo para el monitoreo decombustibles forestales SIMMCOF Centro de InvestigacioacutenRegional del Paciacutefico Centro Campo Experimental Centro Altos de Jalisco INIFAP Folleto Teacutecnico no 1 47 p
Gould W G Gonzaacutelez A T Hudak T Nettleton H and JHollingsworth 2008 Forest structure and downed woodydebris in boreal temperate and tropical forest fragments Ambio 37(7-8) 577-587
Hosmer D W and S Lemeshow 2000 Applied LogisticRegression Wiley New York 392 p
INEGI 2004 Carta de Uso del Suelo y Vegetacioacuten 1250 000Insightful Corporation 2002 S-plus v 8p for WindowsEnterprise Developer Edition Washington USA
Jain T B W A Gould R T Graham D S Pilliod L BLentile and G Gonzaacutelez 2008 A soil burn severity indexfor understanding soil-fire relations in tropical forests Ambio 37(7-8) 563-568
Loacutepez P J M Keyes A Gonzaacutelez E F Cabrera y O Saacutenchez1990 Los incendios de Quintana Roo iquestCataacutestrofe ecoloacutegicao evento perioacutedico Ciencia y Desarrollo 16(91) 43-57
Maeda E E A R Formaggio Y E Shimabukono G F B Arcoverde and M C Hansen 2009 Predicting forest firein the Brazilian Amazon using Modis imagery and artificialneural networks Int J Applied Earth Observation andGeoinformation 11(4) 265-272
Maeda E E G F B Arcoverde P K E Pellikka and Y EShimabukoro 2011 Fire risk assessment in the Brazilian Amazon using Modis imagery and change vector analysis Appl Geography 31(1) 76-84
Muntildeoz R C A E J Trevintildeo G J Veraacutestegui Ch J JimeacutenezP y O A Aguirre C 2005 Desarrollo de un modeloespacial para la evaluacioacuten del peligro de incendios forestalesen la Sierra Madre Oriental de Meacutexico InvestigacionesGeograacuteficas 56 101-117
Myers R K and D H van Lear 1998 Hurricane-fireinteractions in coastal forests of the south a review andhypothesis For Ecol Manag 103 265-276
Neri A C D A Rodriacuteguez T y R Contreras A 2008Inflamabilidad de combustibles forestales en las selvas deCalakmul Campeche Universidad y Ciencia 25(2) 125-132
Pyne S J P L Andrews and R D Laven 1996 Introductionto Wildland Fire 2nd ed Wiley New York 769 p
Ripley B D 1981 Spatial Statistics Wiley New York 252 pRodriacuteguez F C G Vera C F Carrillo A J Chavelas P J C
Escoto P y C Paraguirre L 1989 Evaluacioacuten de dantildeos en lazona afectada por el huracaacuten Gilberto y el incendio ocurridoel presente antildeo CIFAP-Meacutex Reporte Teacutecnico 100 p
Rodriacuteguez T D A H Ramiacuterez M H Tchikoueacute y J SantillaacutenP 2008 Factores que inciden en la siniestralidad de incendios
forestales Ciencia For Meacutex 33(104) 37-58SAS Institute 2002 Statistical Analysis System v 90 for
Microcomputers Cary North Carolina USASuaacuterez M E y E Rivera A 1998 Zooplancton e hidrodinaacutemica
en zonas litorales y arrecifales de Quintana Roo MeacutexicoHidrobioloacutegica 8 19-32
Uriarte M and M Papaik 2007 Hurricane impacts ondynamics structure and carbon sequestration potential offorest ecosystems in southern New England USA Tellus59A 519-528
Van Wagner C E and T L Picket 1985 Equations andFORTRAN program for the Canadian Forest Fire WeatherIndex System Forestry Technical Report 33 CanadianForest Service Ottawa Ontario 18 p
Villa S A B E A Hernaacutendez O y V E Sosa C (eds)1990 Plan de manejo silviacutecola integral de la zona norte deQuintana Roo AMPF A C Meacutexico D F 100 p