TL;DR

Prime made for students and young adults
- Fast, free delivery for dorm and study essentials
- Prime Video and Amazon Music included
- Member-only deals
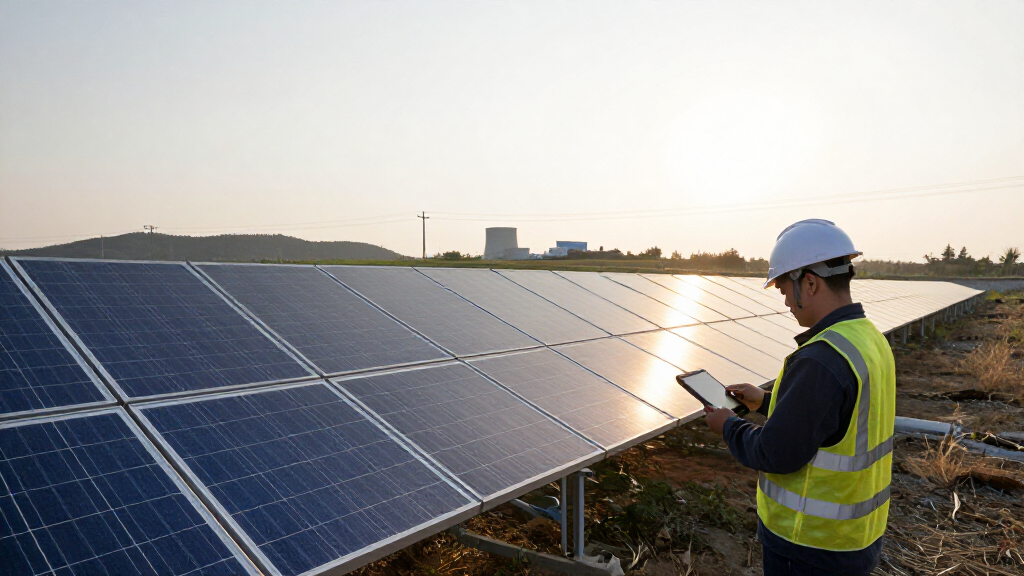
Global solar generation surpassed nuclear power for the first time in 2025, according to the World Nuclear Industry Status Report 2026. The report says solar generation rose 30% while nuclear output increased 1.1%; monthly data show solar exceeded nuclear in April 2025. The comparison concerns electricity generation, not installed capacity, and the report’s solar capacity estimate is more conservative than another cited data source.
Global solar power generation surpassed nuclear output in 2025 for the first time, according to the World Nuclear Industry Status Report (WNISR) 2026. The report says solar generation jumped 30% that year, while nuclear generation rose 1.1%, marking a shift in the relative contribution of the two sources to global electricity supply.
The report, overseen by French nuclear energy consultant Mycle Schneider, says wind generation first exceeded nuclear on a monthly basis in March 2025, followed by solar in April. From March 2025 through June 2026, either wind or solar individually generated more electricity than nuclear each month. In March, April and May 2026, both sources separately outgenerated nuclear.
The growth gap is also visible in installed capacity, although capacity and electricity generation measure different things. WNISR records 510 gigawatts of solar capacity added in 2025, bringing the total to 2,383 GW, and 159 GW of new wind capacity, for a total of 1,291 GW. Installed nuclear capacity increased by 1.5 GW to 399.5 GW, while the report’s measure of operating nuclear capacity fell by 0.5 GW to 368.6 GW.
WNISR’s solar additions figure is conservative relative to data from IEA PVPS cited by pv magazine Global. Those figures put global photovoltaic additions at about 690 GW in 2025, roughly 180 GW above WNISR’s estimate. The sources therefore differ on the scale of new solar capacity, but both figures point to substantial expansion. The report says global nuclear plants generated 2,703 terawatt-hours in 2025; output outside China fell 0.2%, while China’s nuclear generation rose 7.6%.
Solar’s Faster Growth Changes the Mix
The finding matters because it captures a change in the global electricity mix, not simply a capacity milestone. Solar’s annual generation overtaking nuclear reflects both rapid deployment and rising output from existing installations. Nuclear generation also grew in 2025, but at a far slower rate, and its share of global electricity fell to 8.8%, the lowest level in four and a half decades, according to WNISR.
Rapid solar growth brings practical challenges as well as additional supply. Solar output varies with daylight and weather, while electricity demand continues beyond sunny hours. WNISR points to falling battery costs as one factor that may support further photovoltaic expansion and help grids manage variable generation. It reports that 104 GW of grid-scale batteries, with 257 gigawatt-hours of storage capacity, were connected in 2025. More than 78% of cumulative battery storage capacity was installed from 2023 through 2025.
The comparison does not by itself establish which technology is preferable or what role either will play in a particular country. Generation depends on local resources, plant availability, grid design and demand. But the figures underline how quickly solar is adding electricity worldwide compared with the slow pace of nuclear expansion described in the report.
As an affiliate, we earn on qualifying purchases.
A Long Plateau in Nuclear Output
WNISR describes global nuclear capacity as essentially flat for more than 25 years, while solar and wind capacity have grown rapidly. Nuclear’s electricity share peaked at 17.5% in 1996, the report says, before declining to 8.8% in 2025. Four reactors began supplying electricity in 2025 and seven closed, producing a negative annual balance of three reactors.
As of July 1, 2026, the report counted 411 operating reactors in 31 countries, excluding 30 units in long-term outage. It also reported 73 reactors under construction, the highest count since 1987, with China accounting for 37. The construction pipeline does not mean those reactors are producing power now: among 16 reactors connected to the grid from 2023 to 2025, none finished on schedule, and their average construction time was 10.9 years, according to WNISR.
New nuclear construction remains concentrated in China and Russia. Of 12 construction starts recorded in 2025, nine were in China, two in Russia and one in South Korea. The report also notes that solar capacity figures vary by source, and its generation comparison should not be confused with a comparison of installed capacity or with monthly results alone.
“The reality of the nuclear industry on the ground is quite sobering for those who expected to find a booming sector.”
— Mycle Schneider, WNISR overseer, speaking to pv magazine Global
As an affiliate, we earn on qualifying purchases.
Capacity Estimates Vary by Source
The broad finding that solar generation exceeded nuclear generation in 2025 is attributed to WNISR 2026, but the supplied report does not provide a full underlying monthly dataset or a detailed method for reconciling generation figures. Solar capacity additions also vary between WNISR’s estimate of 510 GW and the roughly 690 GW figure cited from IEA PVPS. The difference affects estimates of how quickly capacity grew, but it does not change the report’s stated generation result.
It is also unclear from the supplied material how much of the 2025 generation comparison reflects new capacity versus changes in weather, plant availability and other operating conditions. The report’s figures describe global totals and do not establish the same pattern in every country or electricity system. Its assessment of battery deployment and future grid effects is a report finding, not a guarantee of how quickly storage will address variability.
As an affiliate, we earn on qualifying purchases.
Further Generation Data Will Clarify Trends
The next useful test will be whether subsequent annual data show solar remaining ahead of nuclear and whether wind and solar continue their monthly pattern. Later releases from energy agencies and industry data providers may also help reconcile the differences in reported 2025 photovoltaic additions and provide more detail on how generation was calculated.
For nuclear, the report points to reactor construction schedules, new project starts and actual output as measures to watch. For solar and storage, future capacity additions and battery deployment will indicate whether rapid growth can be sustained alongside grid needs. The supplied source material does not give a date for a follow-up report or a forecast for when these comparisons will next be updated.
As an affiliate, we earn on qualifying purchases.
Key Questions
What does it mean that solar surpassed nuclear?
It means global solar electricity generation in 2025 exceeded nuclear generation, according to WNISR 2026. It does not mean solar had more installed capacity than nuclear under every measure, or that solar outgenerated nuclear in every country.
When did solar first exceed nuclear in a month?
WNISR says solar generation first moved ahead of nuclear on a monthly basis in April 2025. Wind had already surpassed nuclear in March 2025.
How quickly did solar and nuclear generation grow in 2025?
The report says solar generation rose 30% in 2025, while nuclear generation increased 1.1%. Nuclear output outside China declined 0.2%, while China’s nuclear generation rose 7.6%.
Why do reports give different solar capacity figures?
WNISR records 510 GW of solar capacity additions in 2025. IEA PVPS figures cited by pv magazine Global put photovoltaic additions at about 690 GW. The sources use different estimates; the supplied material does not explain their methodologies in detail.
Does the result mean nuclear power is declining everywhere?
No. WNISR says nuclear generation increased globally by 1.1% in 2025, largely because output in China rose. It declined slightly outside China, so the global total masks different national trends.
Source: hn
Halloween Picks
halloween
As an affiliate, we earn on qualifying purchases.