
BULETINUL INSTITUTULUI POLITEHNIC DIN IAŞI
Publicat de
Universitatea Tehnică „Gheorghe Asachi” din Iaşi
Volumul 65 (69), Numărul 1, 2019
Secţia
MATEMATICĂ. MECANICĂ TEORETICĂ. FIZICĂ
NEW EXPERIMENTAL APPROACH OF ATMOSPHERIC
POLLUTANT COMPOUNDS DETECTION
BY
OTILIA – SANDA PRELIPCEANU
1,2, ȘTEFAN HAVRILIUC
3,
IONUȚ DĂNUȚ RUSU3, MARIUS MIHAI CAZACU
4, IULIAN ALIN ROȘU
2 and
MARIUS PRELIPCEANU3,
1“Alexandru Ioan Cuza” University of Iași, Romania,
Integrated Centre for Environmental Science Studies in the North-East
Development Region – CERNESIM 2“Alexandru Ioan Cuza” University of Iași, Romania,
Faculty of Physics 3“Ștefan cel Mare” University, Suceava, Romania,
Faculty of Electrical Engineering and Computer Science,
Integrated Center for Research, Development and Innovation for Advanced Materials,
Nanotechnologies and Manufacturing and Control Distributed Systems (MANSiD) 4“Gheorghe Asachi” Technical University of Iași, Romania,
Department of Physics
Received: December 3, 2018
Accepted for publication: February 26, 2019
Abstract. Improving the monitoring techniques of environmental and
meteorological parameters in real time is a continuum challenge in our days.
Based on the Arduino modern platform the atmospheric pollutant compounds
detection can be configured in order to improve the environment management
systems. In this paper, we have developed a compliant air quality monitoring
system in the laboratory, and we have focused mainly on the assessment of
dustiness present both indoors and outdoors. The measurements demonstrate the
use of the system, and the recorded data has led to the elaboration of some
analyses that can explain some of the effects of the atmospheric pollutants.
Keywords: air quality; dust; atmospheric pollutants.
Corresponding author; e-mail: [email protected]
10 Otilia – Sanda Prelipceanu et al.
1. Introduction
Air occupies about 96% of the volume of the Earth atmosphere, the
remaining 4% being occupied by water vapour. Atmospheric air, along with other
environmental components, has a vital significance for nature in general. Air is a
mixture of nitrogen (78%) and oxygen (21%) necessary for the activity of aerobic
organisms, including humans. This mixture also contains an insignificant amount
of other gases: neon, argon, helium, krypton, xenon, radon, carbon dioxide,
hydrogen, water vapour and other particles that practically have no influence on
living organisms. The development of human society leads to the creation of an
anthropogenic negative impact on the air quality (Unga et al., 2013).
The problems of environmental quality control and, implicitly, air
quality, have arisen with the numerical increase of the population that has
occupied, in one form or another, the entire surface of the planet, altering it
profoundly through pollution. These human interventions have triggered a
series of processes that endanger the future of mankind and of our planet
(Minea, 2002). The quality of human life is not just about the quality of air, it
also refers to the quality of indoor air; that is, in our dwelling, at office or in the
classrooms. Our health depends directly on the quality of inhaled air.
Consequently, the construction materials, and the cleaning solutions used for a
building are very important for air quality. Also, the scope of the space or the
way in which the room is ventilated has an important contribution regarding the
air quality (Cazacu et al., 2017).
The new studies show that certain atmospheric pollutants may appear in
bigger quantities inside closed spaces rather than outside (Amarandi et al.,
2018). In the past, less significant attention is paid to interior air pollution,
compared to external air pollution, especially emissions from industrial
activities and traffic. In the last few years, however, there have been many cases
where indoor air pollution has become a real threat. Poor indoor air quality can
be particularly damaging to the sensitive groups such as babies, senior citizens,
and the sufferers of chronic, cardiac and pulmonary diseases. Radon, a
radioactive gas which usually forms in the soil, is one of the main indoor air
pollutants. Cigarette smoke, gases or particles from combustion, chemicals and
allergens are also responsible for the indoor pollution. Carbon monoxide,
nitrogen dioxide, volatile organic compounds and particles can be found both
externally and internally.
For an easy understanding of all the negative effects of air pollution and
in order to determine the capacity to establish ecological recovery and
reconstruction measures, it was necessary to organize and carry out a wide-
ranging environmental quality control, a so-called ecological monitoring or
integrated monitoring (Godeanu, 1997). In parallel with scientific development,
environmental surveillance becomes a systematic and methodical concern,
carried out through various measurement systems, with which various
Bul. Inst. Polit. Iaşi, Vol. 65 (69), Nr. 1, 2019 11
environmental parameters such as temperature, humidity, and solar radiation
have been recorded over a long period of time.
Over time, the tendency to unify the units of measurement for all these
parameters was manifested and materialized, moving from the empirical pursuit
and recording to the systematic, scientific study of all these indicators or factors.
The parameters are monitored for the purpose of describing the climatic
conditions and the changes over time of these factors; the differentiation of
natural phenomena from anthropogenic disturbances, as well as the identification
of ecosystem response to changes in climatic factors, air quality and precipitation.
Parameters that characterize climatic factors, air quality and
precipitation are physical and chemical. Physical parameters include
temperature, wind speed, wind direction, air humidity, atmospheric pressure,
rainfall, while SO2, NO2, NH3, suspended particulate matter and sediment dusts
are among the chemical parameters that characterize air quality. For air samples
to be representative, a number of factors must be taken into account: the source
and the area of pollution, the type of pollutant, spreading area, pollution level
and short-term concentrations.
Because meteorological factors (temperature, humidity, atmospheric
pressure, air currents, precipitation, etc.) cause substantial changes to the air
pollution level, they must be observed and noted along with the pollution level
during measurements.
The air quality monitoring involves a series of actions to observe and
measure the quantity and quality of some air condition indicators, such as the
concentrations of air components. The monitoring system allows us to obtain
useful data for the rapid identification of polluted areas and for strategic and
tactical decisions to combat pollution and to prevent it (Mihăiescu, 2014).
Our air quality monitoring system has been created with financial
accessibility in mind. In addition, another advantage of the system is that it is
possible to modify the parameters according to the research that the students
perform. With our monitoring system, we can measure four main parameters:
air humidity, temperature, CO2 and dust.
For the air humidity and the temperature, we use a single common
sensor, but for the last two parameters, we use two different sensors: one for
CO2 and another for the dust measurement. Sensors control is given by the
Arduino plate using a specific coding language, the code provided by the
manufacturer of each sensor individually and calibrated in the laboratory
according to the needs and functions required in the work.
2. Experimental Setup
The interpretation and use of the sensors are provided by Arduino
Nano, being the smallest data acquisition board that has successfully met all the
requirements of the air quality monitoring device.
12 Otilia – Sanda Prelipceanu et al.
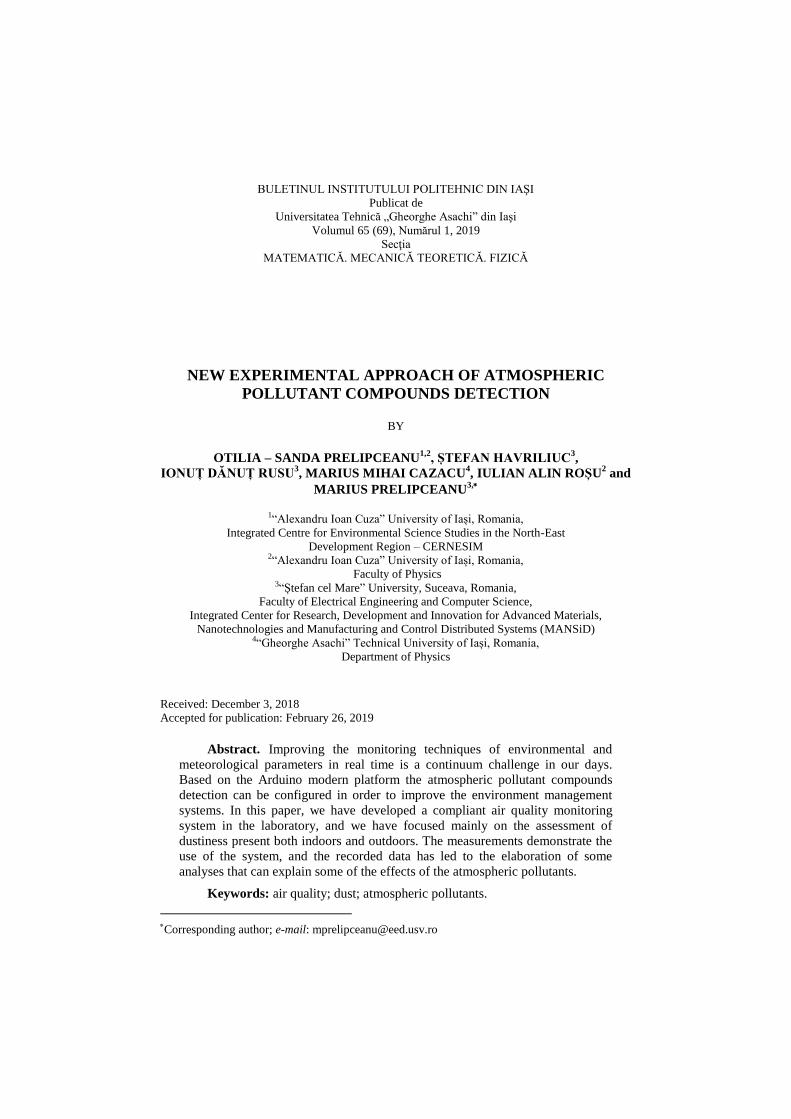
Fig. 1 − Air quality monitoring device scheme.
The Fig. 1 shows the Arduino interconnection scheme with the
atmospheric monitoring sensors and the components required for their use. The
links between the data acquisition board and the sensors are made through
different transmission paths such as I2C protocol, analogue and digital
communications.
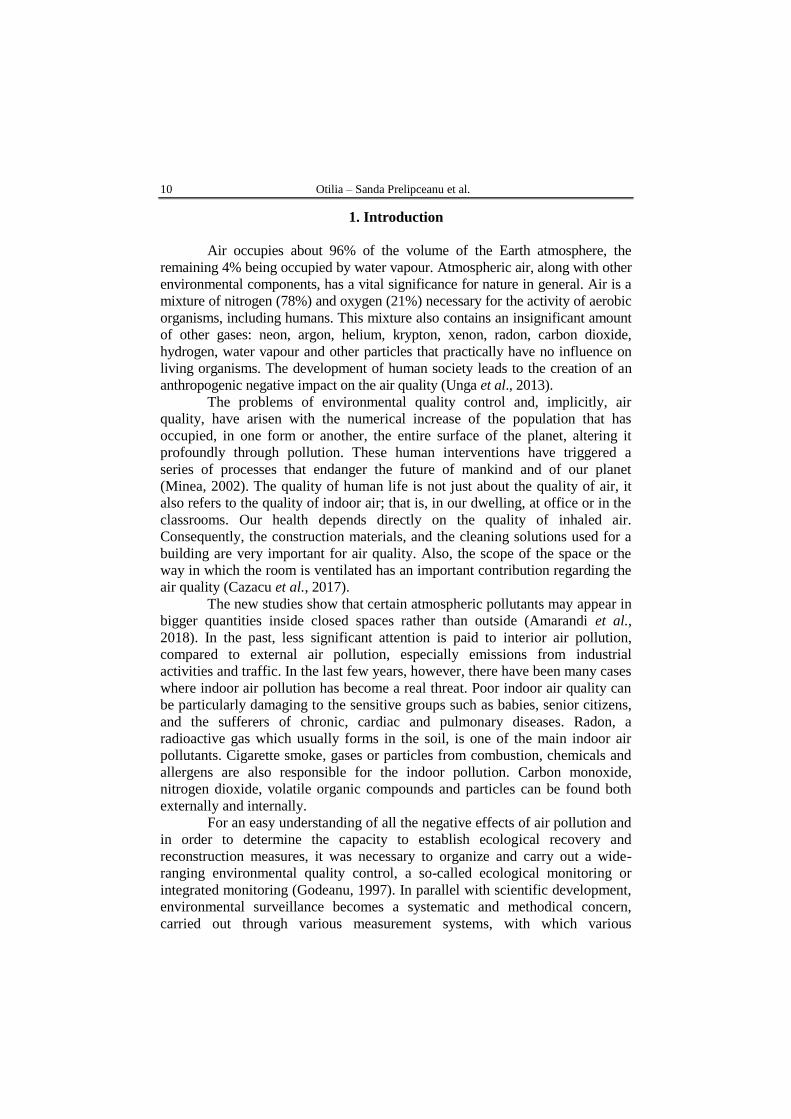
Fig. 2 – Detection and monitoring device in working time.
The practical model (Fig. 2) of the device was made using a test board
on which all sensors were mounted together with the Arduino Nano module.
The device comes with an LCD monitor that displays numerically real-time
Bul. Inst. Polit. Iaşi, Vol. 65 (69), Nr. 1, 2019 13
measured data about temperature, humidity, carbon dioxide and dust density,
and can be used independently without being connected to a computer; the only
thing you need is just connecting to a voltage source or simply connecting to a
power bank. For calibration and verification of sensors we used equipment in
the laboratories provided by the faculty. We chose to design and build our own
detection system as current commercial devices are extremely expensive and in
addition, many of them do not allow us to evaluate all the chemical atmospheric
compounds we want to analyse (Doroftei et al., 2018). In the following chapter
we explain how to connect and use the sensors.
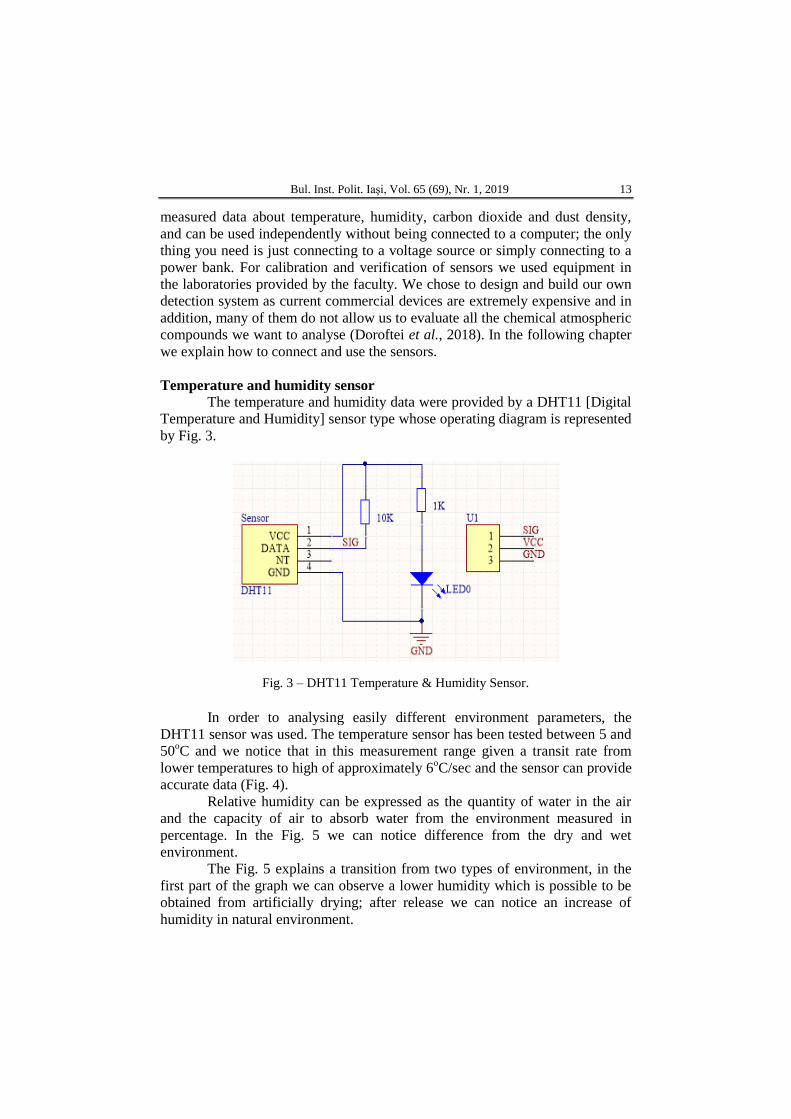
Temperature and humidity sensor
The temperature and humidity data were provided by a DHT11 [Digital
Temperature and Humidity] sensor type whose operating diagram is represented
by Fig. 3.
Fig. 3 – DHT11 Temperature & Humidity Sensor.
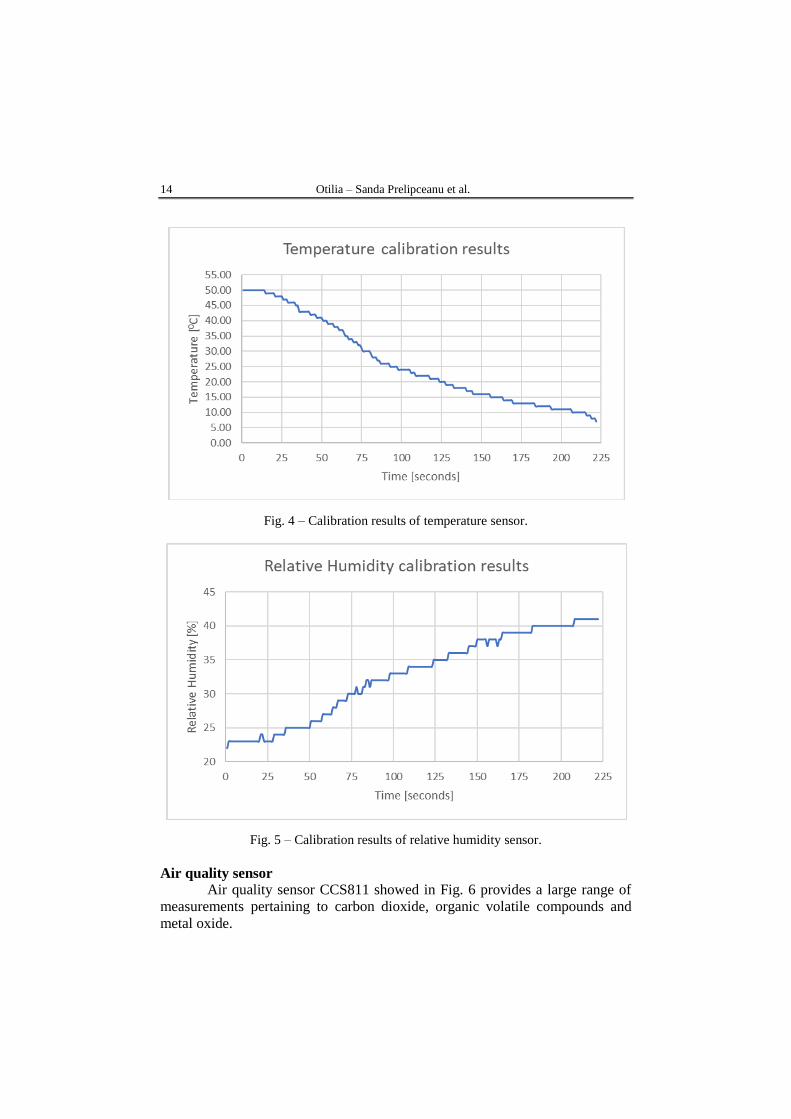
In order to analysing easily different environment parameters, the
DHT11 sensor was used. The temperature sensor has been tested between 5 and
50oC and we notice that in this measurement range given a transit rate from
lower temperatures to high of approximately 6oC/sec and the sensor can provide
accurate data (Fig. 4).
Relative humidity can be expressed as the quantity of water in the air
and the capacity of air to absorb water from the environment measured in
percentage. In the Fig. 5 we can notice difference from the dry and wet
environment.
The Fig. 5 explains a transition from two types of environment, in the
first part of the graph we can observe a lower humidity which is possible to be
obtained from artificially drying; after release we can notice an increase of
humidity in natural environment.
14 Otilia – Sanda Prelipceanu et al.
Fig. 4 – Calibration results of temperature sensor.
Fig. 5 – Calibration results of relative humidity sensor.
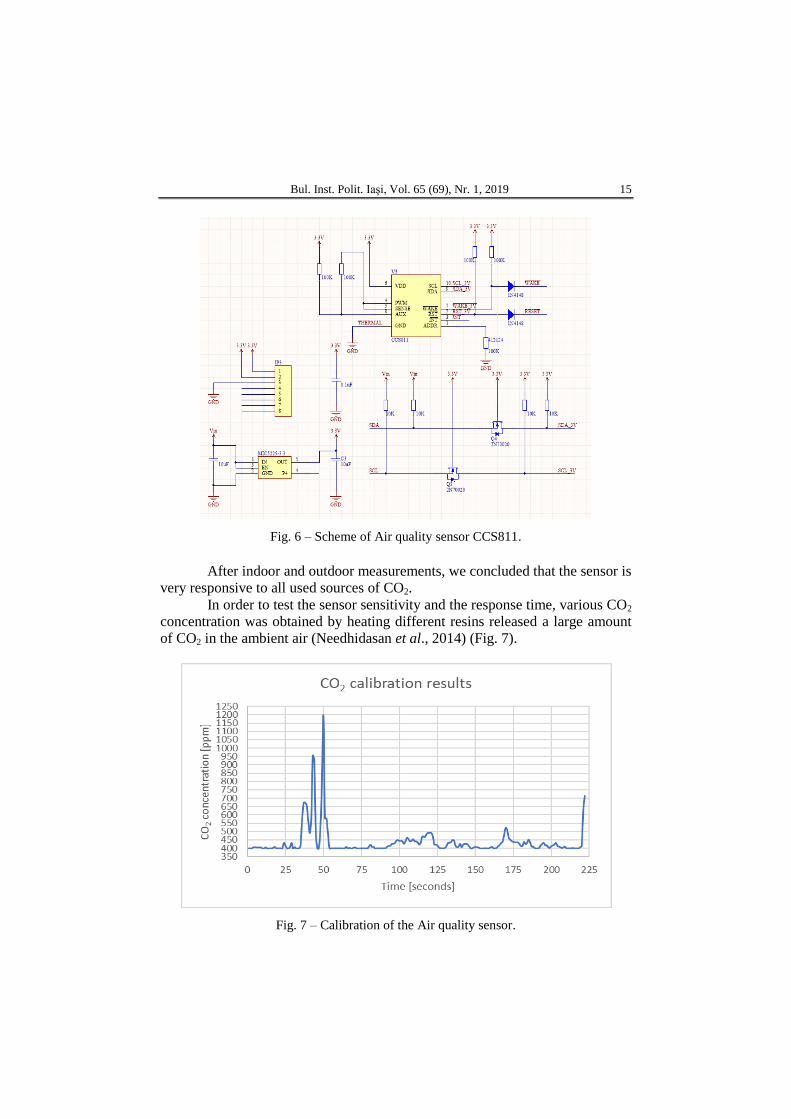
Air quality sensor
Air quality sensor CCS811 showed in Fig. 6 provides a large range of
measurements pertaining to carbon dioxide, organic volatile compounds and
metal oxide.
Bul. Inst. Polit. Iaşi, Vol. 65 (69), Nr. 1, 2019 15
Fig. 6 – Scheme of Air quality sensor CCS811.
After indoor and outdoor measurements, we concluded that the sensor is
very responsive to all used sources of CO2.
In order to test the sensor sensitivity and the response time, various CO2
concentration was obtained by heating different resins released a large amount
of CO2 in the ambient air (Needhidasan et al., 2014) (Fig. 7).
Fig. 7 – Calibration of the Air quality sensor.
16 Otilia – Sanda Prelipceanu et al.
In the first quarter of the graph Fig. 7 we notice a rise in the number of
parts per million (ppm) of CO2, generated as a by-product by heating equipment
for soldering, after which a period when the sensor was extracted from the
polluted environment to see how CO2 stabilizes in an unpolluted environment.
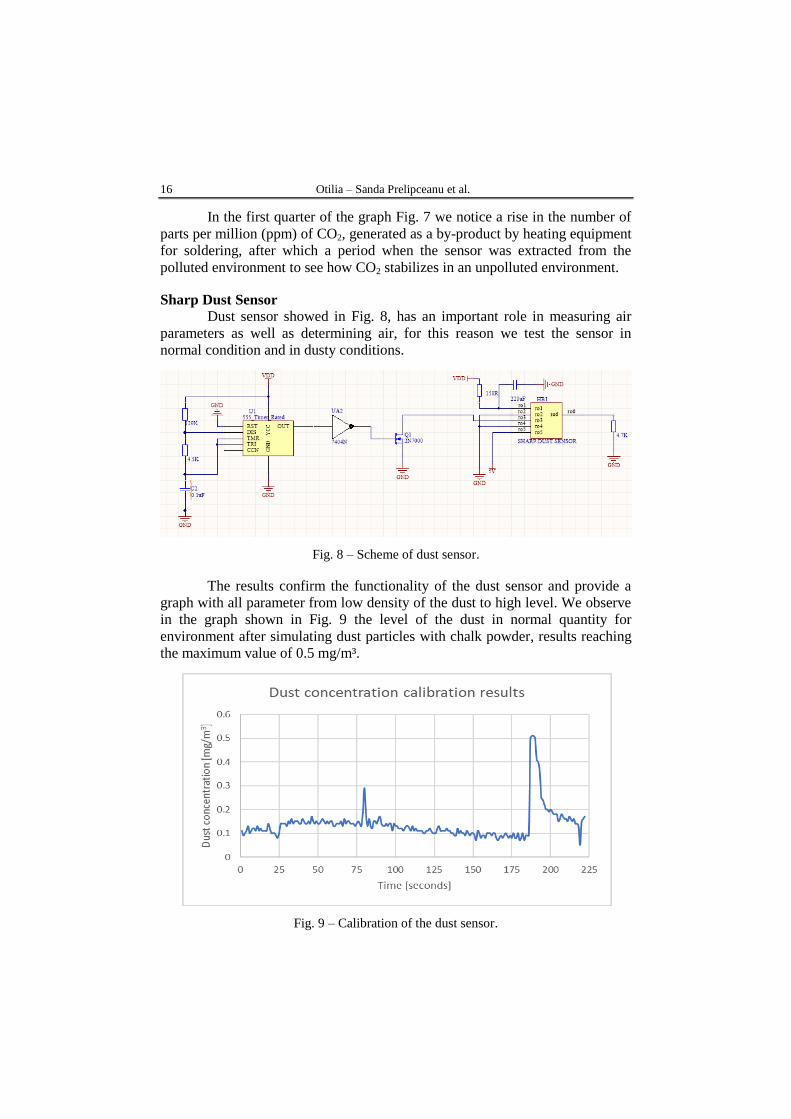
Sharp Dust Sensor
Dust sensor showed in Fig. 8, has an important role in measuring air
parameters as well as determining air, for this reason we test the sensor in
normal condition and in dusty conditions.
Fig. 8 – Scheme of dust sensor.
The results confirm the functionality of the dust sensor and provide a
graph with all parameter from low density of the dust to high level. We observe
in the graph shown in Fig. 9 the level of the dust in normal quantity for
environment after simulating dust particles with chalk powder, results reaching
the maximum value of 0.5 mg/m³.
Fig. 9 – Calibration of the dust sensor.
Bul. Inst. Polit. Iaşi, Vol. 65 (69), Nr. 1, 2019 17
3. Results
The designed monitoring system has been tested under different
temperature and humidity conditions. In order to have an overview, experiments
were conducted both in enclosed spaces where various activities were carried
out, but also in an open environment. The outside environment measurements
were performed before and after precipitation periods (Kahn, 2006). The data
clearly show the times when our breathing air is simply contaminated with dust
particles and various chemical compounds but also episodes, especially after
rainfall has taken place in the form of snow, in which the atmosphere becomes
considerably cleaner.
Inside data processing
In order to be able to make a clearer analysis of the data obtained in
closed populated areas, we have collected data on temperature, humidity, CO2
level and particle level in the air.
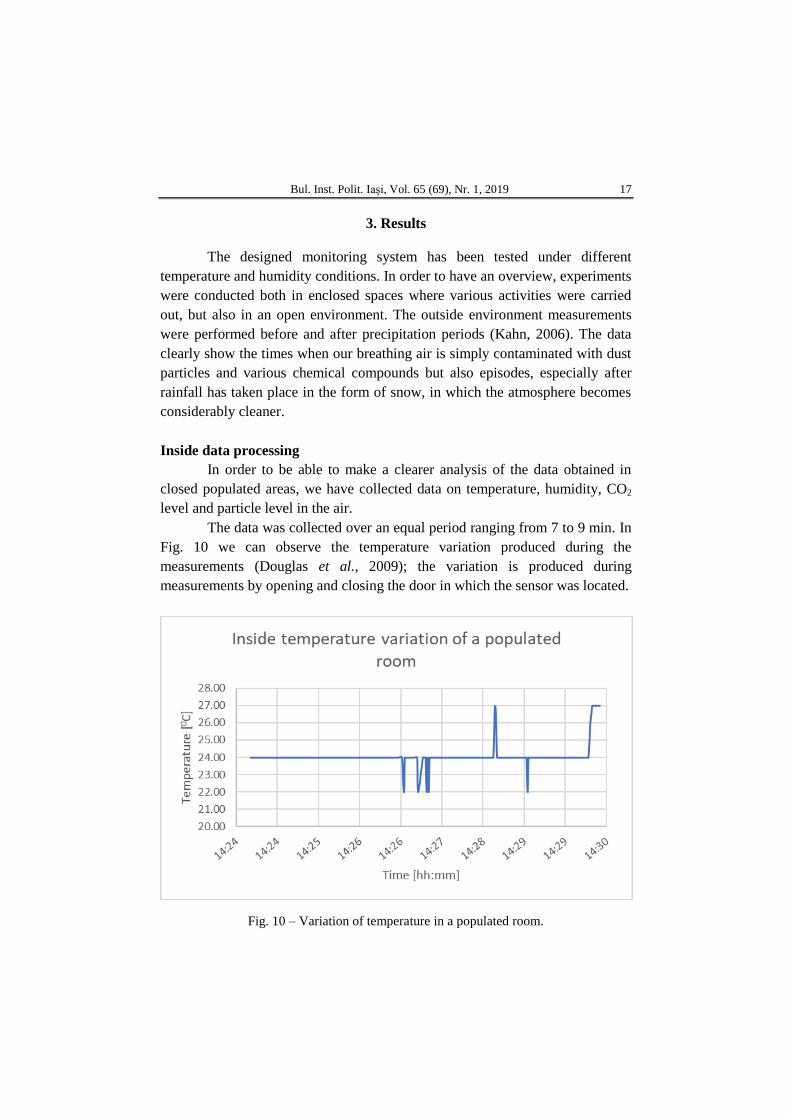
The data was collected over an equal period ranging from 7 to 9 min. In
Fig. 10 we can observe the temperature variation produced during the
measurements (Douglas et al., 2009); the variation is produced during
measurements by opening and closing the door in which the sensor was located.
Fig. 10 – Variation of temperature in a populated room.
18 Otilia – Sanda Prelipceanu et al.
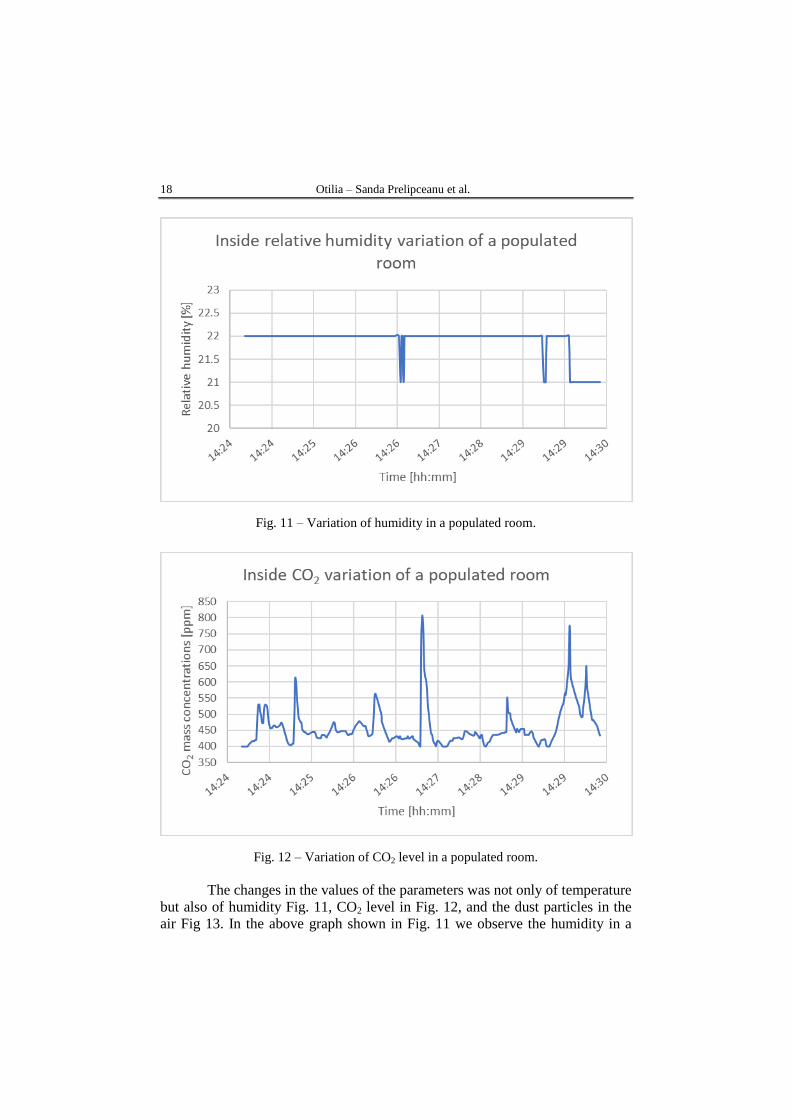
Fig. 11 – Variation of humidity in a populated room.
Fig. 12 – Variation of CO2 level in a populated room.
The changes in the values of the parameters was not only of temperature
but also of humidity Fig. 11, CO2 level in Fig. 12, and the dust particles in the
air Fig 13. In the above graph shown in Fig. 11 we observe the humidity in a
Bul. Inst. Polit. Iaşi, Vol. 65 (69), Nr. 1, 2019 19
climatic environment controlled by a district heating network, which has
negative effects, the humidity drop being a major one at about 22 percent which
can create a respiratory discomfort or dry skin.
The carbon dioxide (Fig. 12) in the environment measured in the
enclosed space with an artificially controlled climate confirms that it has normal
values (Raw et al., 2002). In terms of sensitivity, this sensor has the most
sensitivity in closed spaces, being very easily influenced by disturbing factors
such as heat and touch of the sensor.
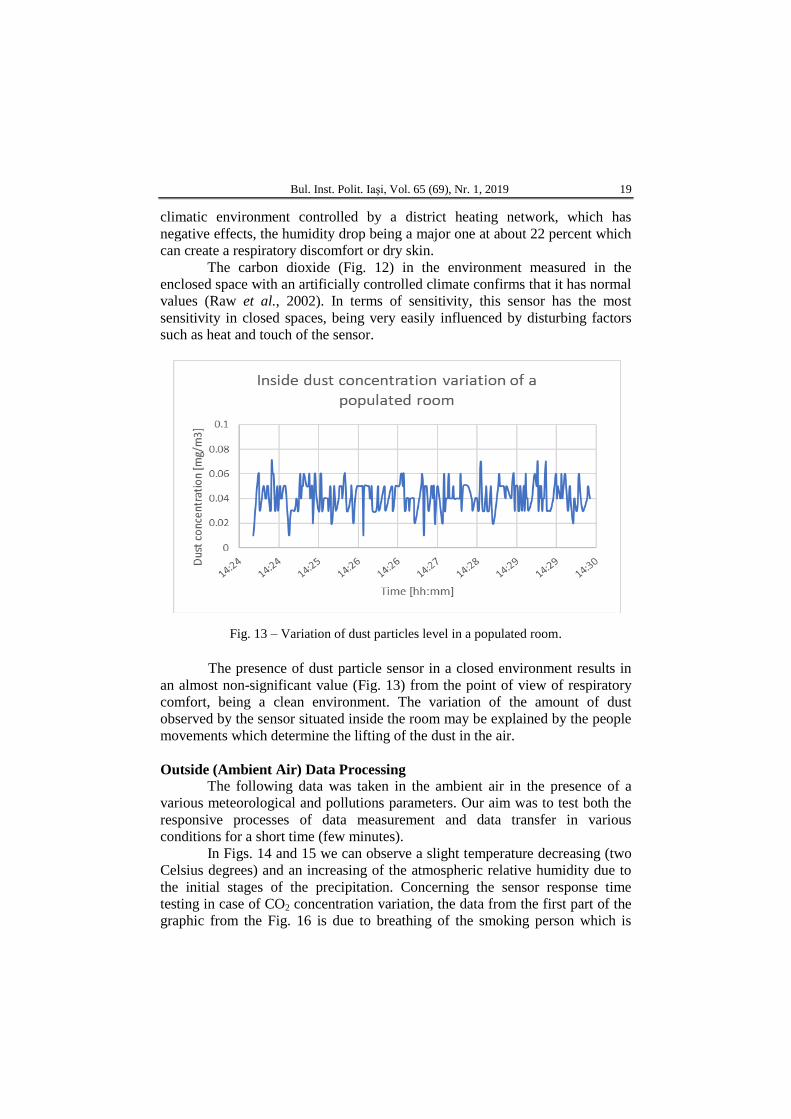
Fig. 13 – Variation of dust particles level in a populated room.
The presence of dust particle sensor in a closed environment results in
an almost non-significant value (Fig. 13) from the point of view of respiratory
comfort, being a clean environment. The variation of the amount of dust
observed by the sensor situated inside the room may be explained by the people
movements which determine the lifting of the dust in the air.
Outside (Ambient Air) Data Processing
The following data was taken in the ambient air in the presence of a
various meteorological and pollutions parameters. Our aim was to test both the
responsive processes of data measurement and data transfer in various
conditions for a short time (few minutes).
In Figs. 14 and 15 we can observe a slight temperature decreasing (two
Celsius degrees) and an increasing of the atmospheric relative humidity due to
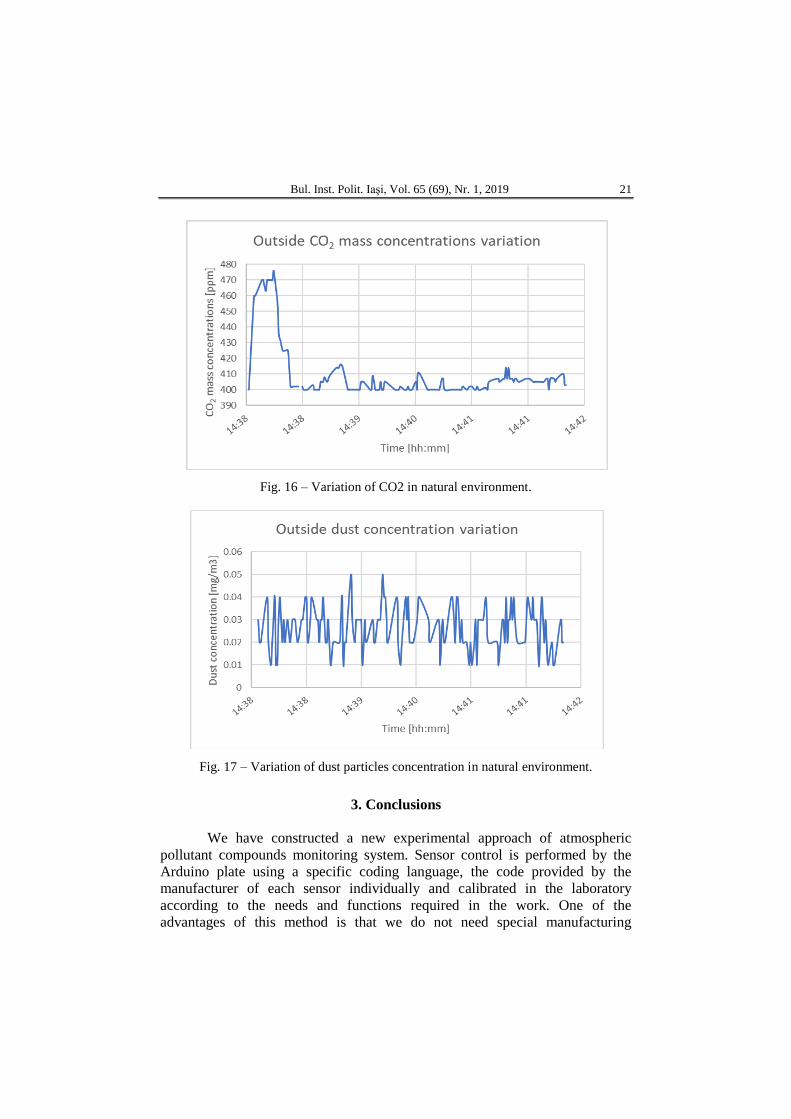
the initial stages of the precipitation. Concerning the sensor response time
testing in case of CO2 concentration variation, the data from the first part of the
graphic from the Fig. 16 is due to breathing of the smoking person which is
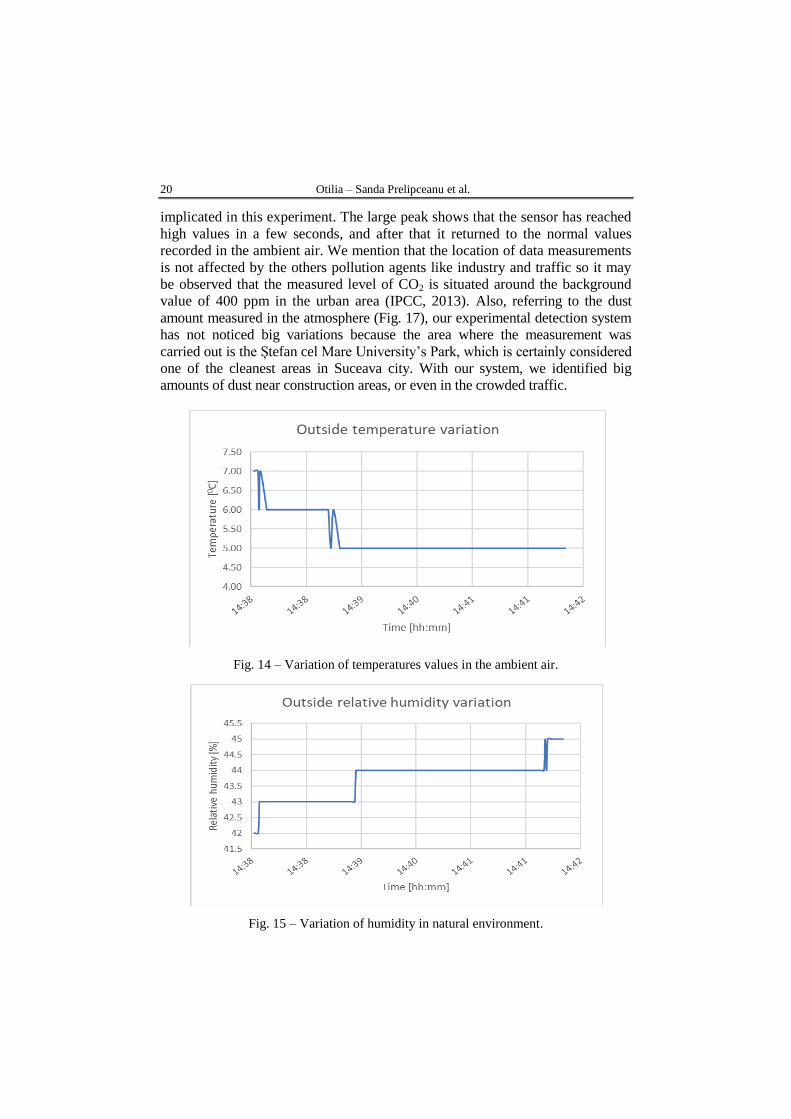
20 Otilia – Sanda Prelipceanu et al.
implicated in this experiment. The large peak shows that the sensor has reached
high values in a few seconds, and after that it returned to the normal values
recorded in the ambient air. We mention that the location of data measurements
is not affected by the others pollution agents like industry and traffic so it may
be observed that the measured level of CO2 is situated around the background
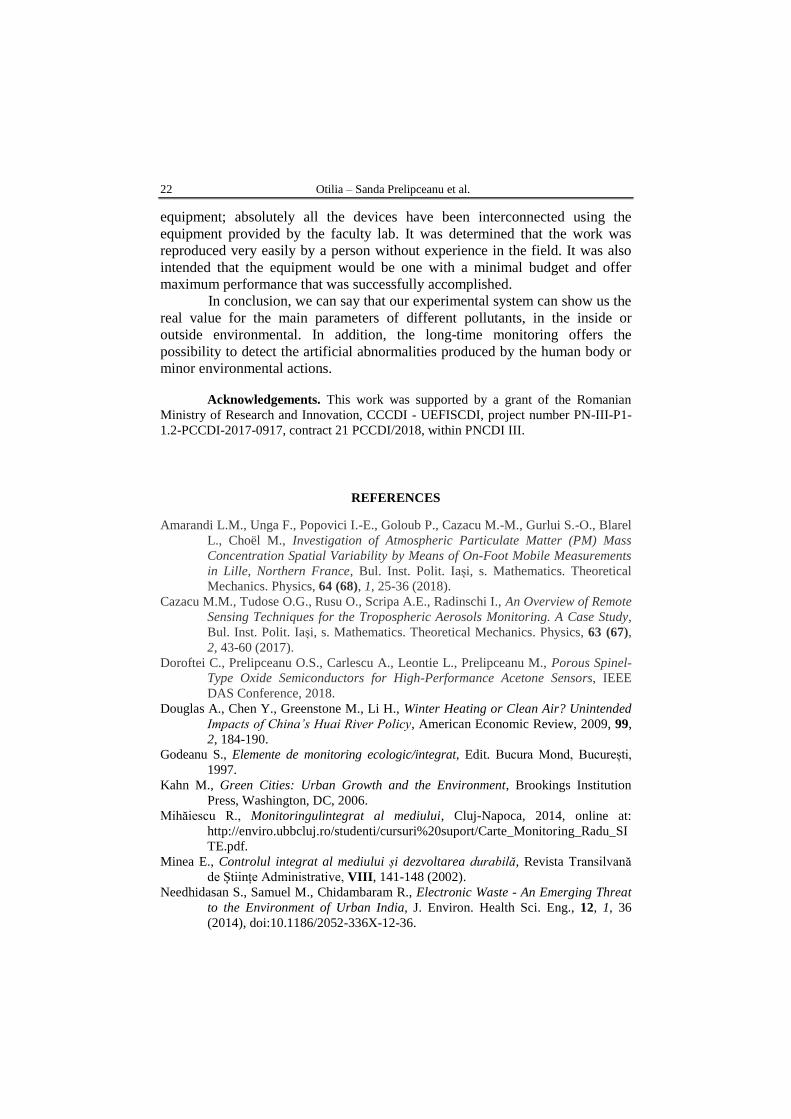
value of 400 ppm in the urban area (IPCC, 2013). Also, referring to the dust
amount measured in the atmosphere (Fig. 17), our experimental detection system
has not noticed big variations because the area where the measurement was
carried out is the Ștefan cel Mare University’s Park, which is certainly considered
one of the cleanest areas in Suceava city. With our system, we identified big
amounts of dust near construction areas, or even in the crowded traffic.
Fig. 14 – Variation of temperatures values in the ambient air.
Fig. 15 – Variation of humidity in natural environment.
Bul. Inst. Polit. Iaşi, Vol. 65 (69), Nr. 1, 2019 21
Fig. 16 – Variation of CO2 in natural environment.
Fig. 17 – Variation of dust particles concentration in natural environment.
3. Conclusions
We have constructed a new experimental approach of atmospheric
pollutant compounds monitoring system. Sensor control is performed by the
Arduino plate using a specific coding language, the code provided by the
manufacturer of each sensor individually and calibrated in the laboratory
according to the needs and functions required in the work. One of the
advantages of this method is that we do not need special manufacturing
22 Otilia – Sanda Prelipceanu et al.
equipment; absolutely all the devices have been interconnected using the
equipment provided by the faculty lab. It was determined that the work was
reproduced very easily by a person without experience in the field. It was also
intended that the equipment would be one with a minimal budget and offer
maximum performance that was successfully accomplished.
In conclusion, we can say that our experimental system can show us the
real value for the main parameters of different pollutants, in the inside or
outside environmental. In addition, the long-time monitoring offers the
possibility to detect the artificial abnormalities produced by the human body or
minor environmental actions.
Acknowledgements. This work was supported by a grant of the Romanian
Ministry of Research and Innovation, CCCDI - UEFISCDI, project number PN-III-P1-
1.2-PCCDI-2017-0917, contract 21 PCCDI/2018, within PNCDI III.
REFERENCES
Amarandi L.M., Unga F., Popovici I.-E., Goloub P., Cazacu M.-M., Gurlui S.-O., Blarel
L., Choël M., Investigation of Atmospheric Particulate Matter (PM) Mass
Concentration Spatial Variability by Means of On-Foot Mobile Measurements
in Lille, Northern France, Bul. Inst. Polit. Iași, s. Mathematics. Theoretical
Mechanics. Physics, 64 (68), 1, 25-36 (2018).
Cazacu M.M., Tudose O.G., Rusu O., Scripa A.E., Radinschi I., An Overview of Remote
Sensing Techniques for the Tropospheric Aerosols Monitoring. A Case Study,
Bul. Inst. Polit. Iași, s. Mathematics. Theoretical Mechanics. Physics, 63 (67),
2, 43-60 (2017).
Doroftei C., Prelipceanu O.S., Carlescu A., Leontie L., Prelipceanu M., Porous Spinel-
Type Oxide Semiconductors for High-Performance Acetone Sensors, IEEE
DAS Conference, 2018.
Douglas A., Chen Y., Greenstone M., Li H., Winter Heating or Clean Air? Unintended
Impacts of China’s Huai River Policy, American Economic Review, 2009, 99,
2, 184-190.
Godeanu S., Elemente de monitoring ecologic/integrat, Edit. Bucura Mond, București,
1997.
Kahn M., Green Cities: Urban Growth and the Environment, Brookings Institution
Press, Washington, DC, 2006.
Mihăiescu R., Monitoringulintegrat al mediului, Cluj-Napoca, 2014, online at:
http://enviro.ubbcluj.ro/studenti/cursuri%20suport/Carte_Monitoring_Radu_SI
TE.pdf.
Minea E., Controlul integrat al mediului și dezvoltarea durabilă, Revista Transilvană
de Științe Administrative, VIII, 141-148 (2002).
Needhidasan S., Samuel M., Chidambaram R., Electronic Waste - An Emerging Threat
to the Environment of Urban India, J. Environ. Health Sci. Eng., 12, 1, 36
(2014), doi:10.1186/2052-336X-12-36.
Bul. Inst. Polit. Iaşi, Vol. 65 (69), Nr. 1, 2019 23
Raw G.J., Coward S.K.D., Llewellyn J.W., Brown V.M., Crump D.R., Ross D.I.,
Indoor Air Quality in English Homes – Introduction and Carbon Monoxide
Findings, Proceedings of Indoor Air, 2002.
Unga F., Cazacu M.M., Timofte A., Bostan D., Mortier A., Dimitriu D.G., Gurlui S.,
Goloub P., Study of Tropospheric Aerosol Types Over Iași, Romania, During
Summer of 2012, Environ. Eng. Manag. J., 12, 297-303 (2013)
**
* IPCC, Climate Change 2013: The Physical Science Basis, in: Intergovernmental
Panel on Climate Change (2013).
NOUĂ ABORDARE EXPERIMENTALĂ A DETECTĂRII
COMPUȘILOR POLUANȚI ATMOSFERICI
(Rezumat)
Odată cu dezvoltarea societății umane a devenit evident faptul că activitatea
umană influențează mediul atmosferic. Managementul mediului a devenit un capitol
esențial pentru orice tip de dezvoltare, indiferent de scala la care se pot manifesta
impactele asupra mediului. În scopul asigurării unei conduceri eficiente a tuturor
activităților sociale, chiar dacă uneori aspectele de mediu par a cădea pe un plan
secundar, s-a impus necesitatea proiectării unor sisteme de supraveghere şi evaluare
continuă a calității mediului. În articolul de faţă am realizat în laborator un sistem
compact de monitorizare a calității aerului și ne-am axat în principal pe evaluarea
cantității de praf prezente atât în interior cât și exterior. Măsurătorile efectuate
demonstrează utilitatea sistemului realizat, iar datele înregistrate au dus la conceperea
unor analize cu ajutorul cărora pot fi explicate unele efecte ale poluanților atmosferici.


