Biroul Naţional de Statistică al Republicii Moldova Национальное бюро статистики Республики Молдова National Bureau of Statistics of the Republic of Moldova POPULAŢIA ŞI PROCESELE DEMOGRAFICE ÎN REPUBLICA MOLDOVA Culegere statistică НАСЕЛЕНИЕ И ДЕМОГРАФИЧЕСКИЕ ПРОЦЕССЫ В РЕСПУБЛИКЕ МОЛДОВА Статистический сборник POPULATION AND DEMOGRAPHIC PROCESSES IN THE REPUBLIC OF MOLDOVA Statistical compilation Chişinău, 2009
Transcript
Biroul Naţional de Statistică al Republicii Moldova Национальное бюро статистики Республики Молдова National Bureau of Statistics of the Republic of Moldova
POPULAŢIA ŞI PROCESELE DEMOGRAFICE ÎN
REPUBLICA MOLDOVA Culegere statistică
НАСЕЛЕНИЕ И ДЕМОГРАФИЧЕСКИЕ ПРОЦЕССЫ В РЕСПУБЛИКЕ МОЛДОВА Статистический сборник
POPULATION AND DEMOGRAPHIC PROCESSES IN THE REPUBLIC OF MOLDOVA
Statistical compilation
Chişinău, 2009
2
Colegiul de redacţie: Vladimir Golovatiuc – Preşedintele colegiului,
Nina Cesnocova, Jana Mazur Редакционная коллегия: Владимир Головатюк – председатель коллегии,
Нина Чеснокова, Жанна Мазур Editorial board: Vladimir Golovatiuc- Boarder president,
Nina Cesnocova, Jana Mazur
Cuprins Содержание
Contents
Prefaţă Предисловие Foreword………………………………………………………………………………………………………………………. 3 Sumar Краткое изложение основных показателей демографического развития Summary…………………………………………………………………………………………………………………….... 4 Organizarea administrativ-teritorială Административно-территориальное устройство Administrative-territorial division……………………………………………………………………………………………. 6 Populaţie Население Population…………………………………………………………………………………………………………………….. 7 Mişcarea naturală a populaţiei Естественное движение населения Vital statistics…………………………………………………………………………………………………………………. 15 Mişcarea migratorie a populaţiei Миграционное движение населения Population’s migration………………………………………………………………………………………………………… 54
Simboluri folosite / Используемые обозначения / Symbols used
- = evenimentul nu există / не было явления / not applicable
… = lipsă de date / сведений нет / data not available
In unele cazuri pot apărea decalaje neînsmnate între totalurile indicate şi sumele componente incluse, fapt ce se explică prin rotunjirea datelor. В отдельных случаях незначительные расхождения между итогом и суммой слагаемых объясняются округлением данных. In some cases, there may occur insignificant discrepancies between the totals and corresponding sums of the components, fact that could be explained by data approximation.
3
PREFAŢĂ Prin publicarea acestei culegeri cu date demografice, Biroul Naţional de Statistică doreşte să vină în întîmpinarea tuturor celor care
sînt interesaţi în cunoaşterea şi studiul populaţiei, fenomenelor şi proceselor demografice.
Culegerea statistică „Populaţia şi procesele demografice în Republica Moldova” conţine date statistice despre împărţirea administrativ-teritorială a ţării şi serii de date statistice cu privire la numărul şi structura demografică a populaţiei, precum şi la mişcarea ei naturală (născuţi, decedaţi, căsătorii, divorţuri) şi migratorie (internaţională).
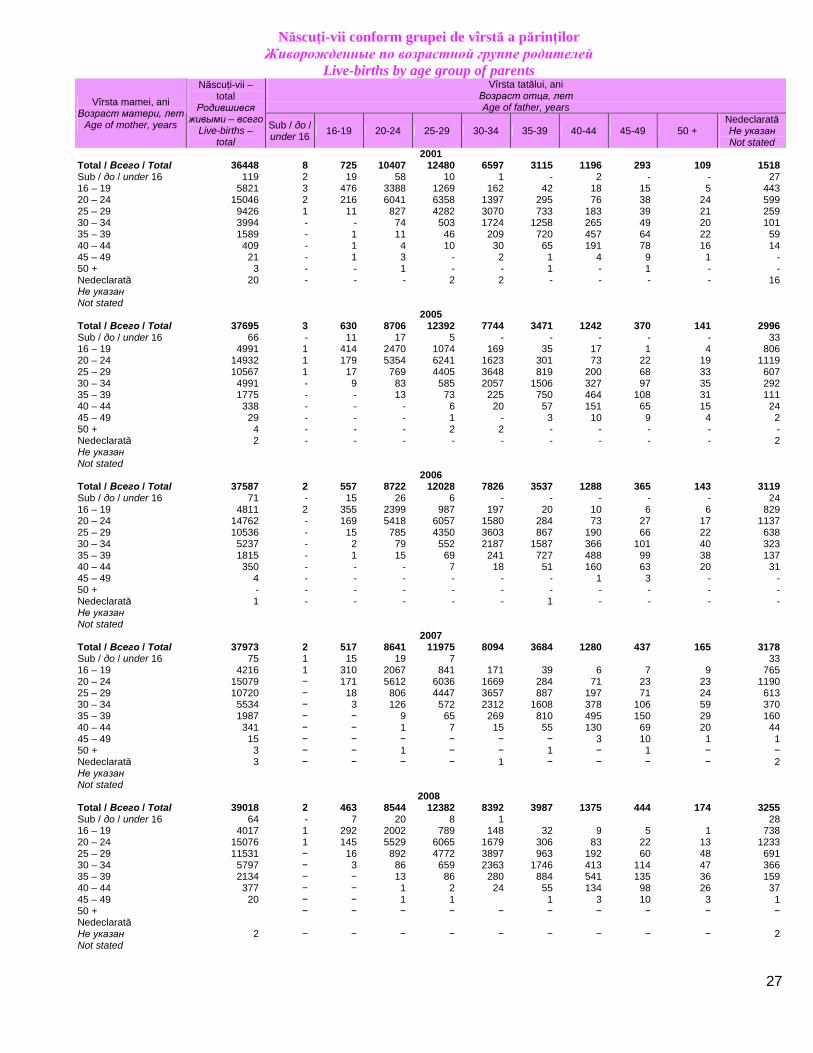
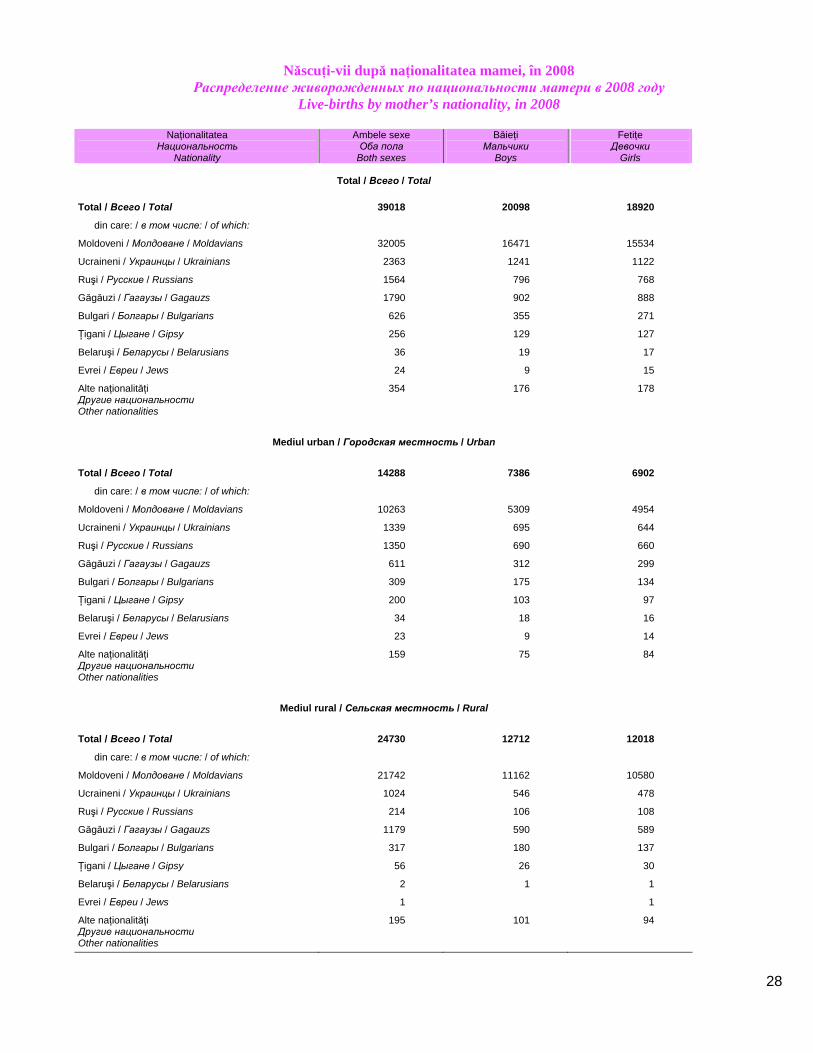
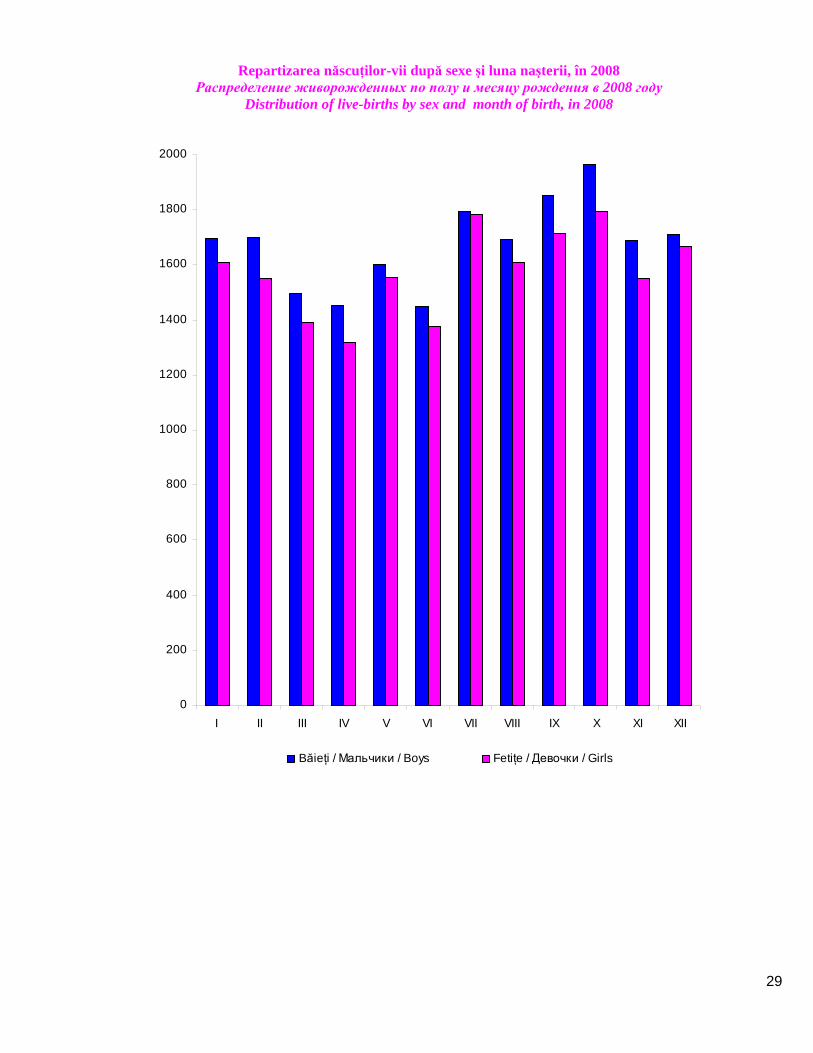
Informaţia despre născuţi este redată conform sexului născutului, rangului, grupei de vîrstă a părinţilor şi stării civile a mamei. Datele despre decedaţi sînt reflectate după vîrstă, sexe şi principalele clase ale cauzelor de deces. În culegere sînt de asemenea incluşi şi indicatori demografici generalizatori ce caracterizează procesele reproducerii populaţiei – rata totală de fertilitate, speranţa de viaţă la naştere şi la unele grupe de vîrstă. Principalii indicatori sînt prezentati fără datele din partea stîngă a Nistrului şi mun. Bender, inclusiv cazuri aparte de înregistrare a actelor de stare civilă a persoanelr de pe acest teritoriu.
Conştienţi de faptul, că aceste date demografice nu ar fi fost produse fără contribuţia Ministerului Dezvoltării Informaţionale, Ministerului Afacerilor Interne, Centrului Ştiinţifico-Practic de Sănătate Publică şi Management Sanitar al Ministerului Sănătăţii al Republicii Moldova, adresăm pe această cale mulţumirile noastre lucrătorilor acestor ministere.
Biroul Naţional de Statistică
ПРЕДИСЛОВИЕ Публикацией данного сборника по демографии Национальное бюро статистики выражает желание помочь всем, кто
заинтересован в познании и изучении вопросов, связанных с населением, демографическими явлениями и процессами, происходящими в стране.
Статистический сборник «Население и демографические процессы в Республике Молдова» содержит данные об административно-территориальном делении страны и серию статистических данных о численности и демографической структуре населения, а также о его естественном движении (родившихся, умерших, браках, разводах) и международной миграции.
Информация о родившихся приведена в разбивке по полу новорожденного, порядку его рождения, возрастной группе родителей, семейному положению матери. Данные об умерших отражены по возрасту, полу и основным классам причин смерти. В сборник также включены основные демографические показатели, характеризующие процессы воспроизводства населения – общий коэффициент рождаемости, ожидаемая продолжительность жизни при рождении и по некоторым возрастным группам.
Основные показатели приведены без данных левобережья Днестра и муниципия Бендер, включая отдельные случаи регистрации актов гражданского состояния жителей этой территории.
Публикуемые данные получены при участии Министерства информационного развития, Министерства внутренних дел, Научно-практического центра общественного здравоохранения и санитарного менеджмента Министерства здравоохранения Республики Молдова, в связи с чем выражаем свою признательность работникам данных министерств.
Национальное бюро статистики FOREWORD
By publishing this collection of demographic data, the National Bureau of Statistics has the goal of helping the ones who are interested in the knowledge and study of the population, demographic phenomena and processes happening in the country.
The statistical compilation “Population and demographic processes in the Republic of Moldova” contains statistical data about the administrative-territorial division of the country and series of statistical data concerning the number and demographic structure of the population, as well as its natural movement (borns, deceased, marriages, divorces) and migratory (international) movement.
The information about the borns is presented in accordance with the new-born’s sex, live-birth order, age group of parents and mother’s marital status. The data about the deceased is reflected by age, sex and main causes of death. The collection also includes demographic generalizing indicators of the population’s reproduction processes – total fertility rate, life expectancy at birth and certain age groups.
The basic indicators are presented without the data from the left side of the river Nistru and municipality Bender, including separate cases of civil status act registration of inhabitants of this territory.
Aware of the fact that the demographic data would not be obtained without the contribution of the Ministry of Informational Development, Ministry of Internal Affairs, Scientific-Practical Centre of Public Health and Sanitary Management of the Ministry of Health of the Republic of Moldova, we express our gratitude to the workers of these ministries.
National Bureau of Statistics
4
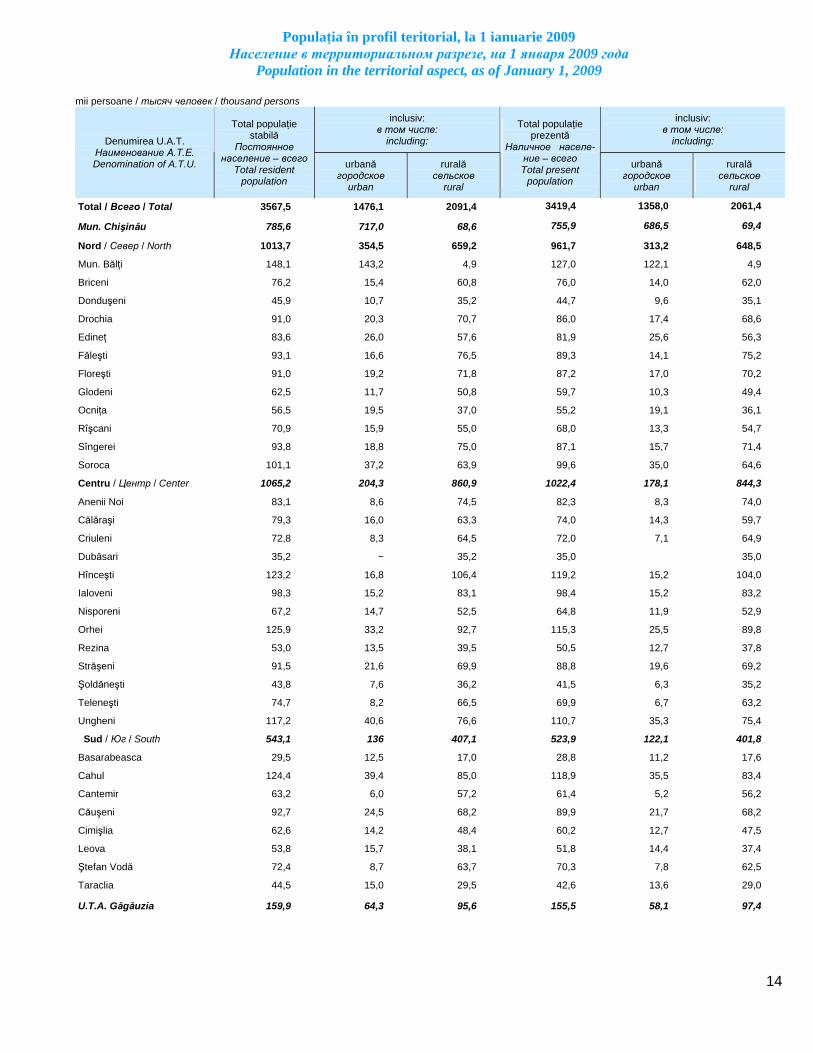
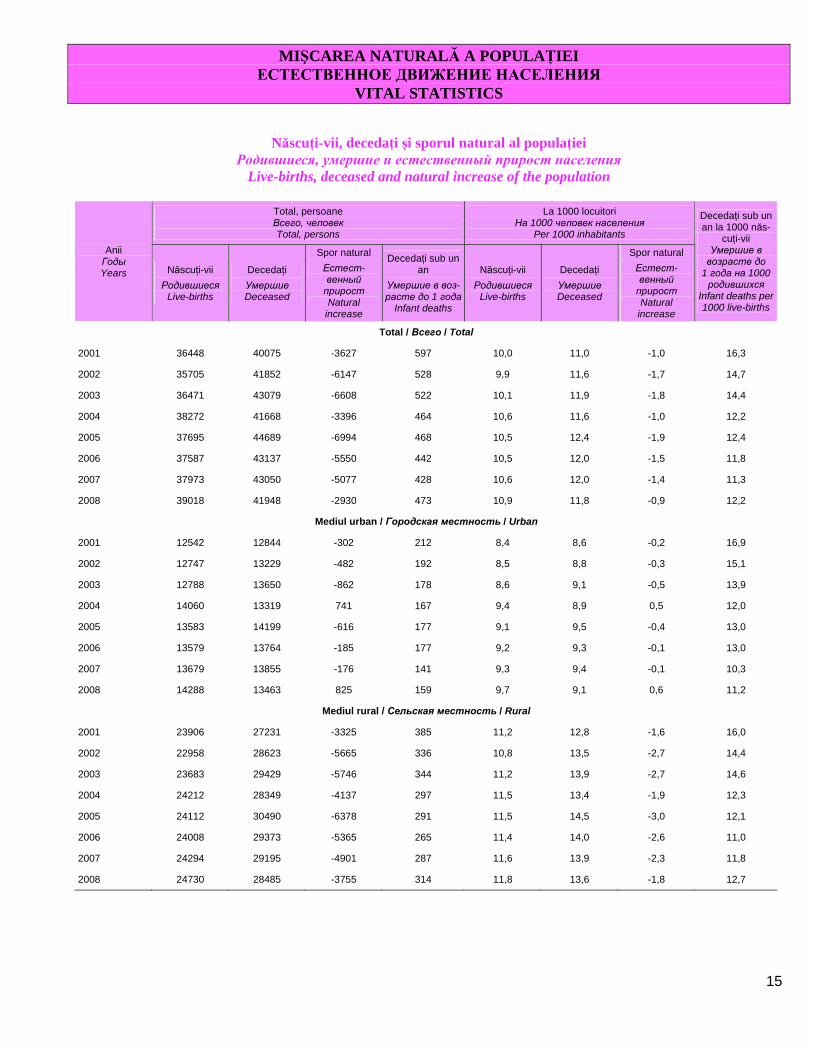
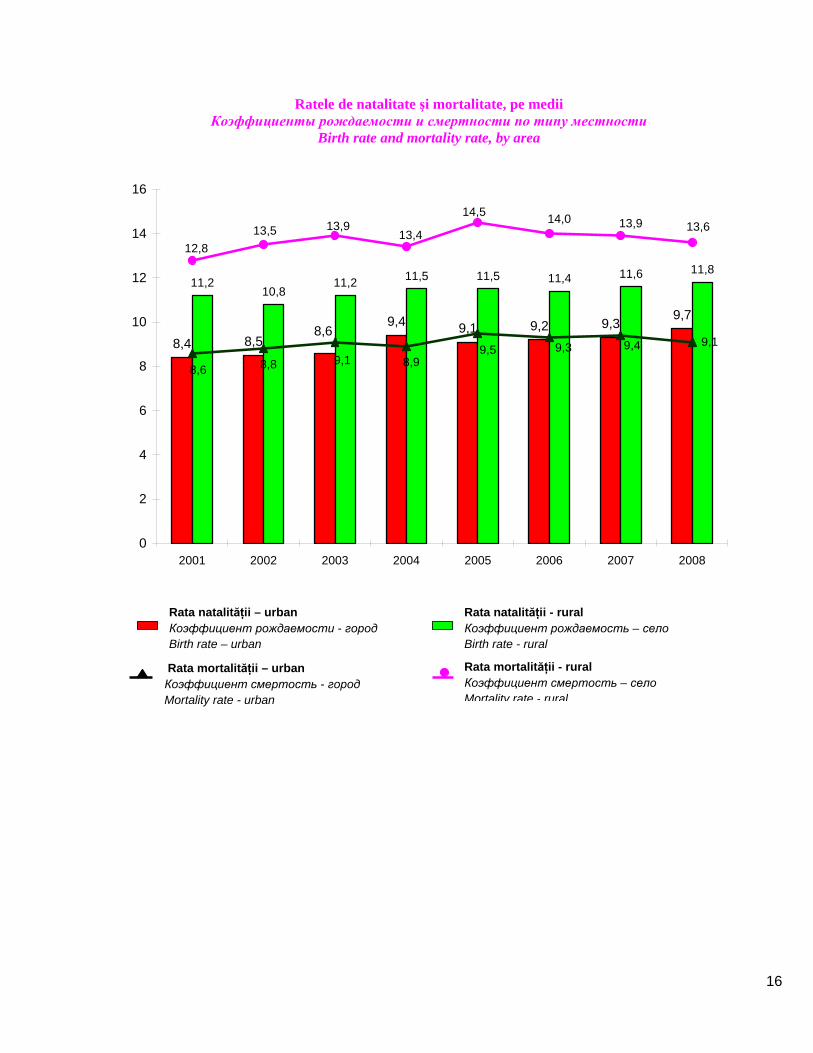
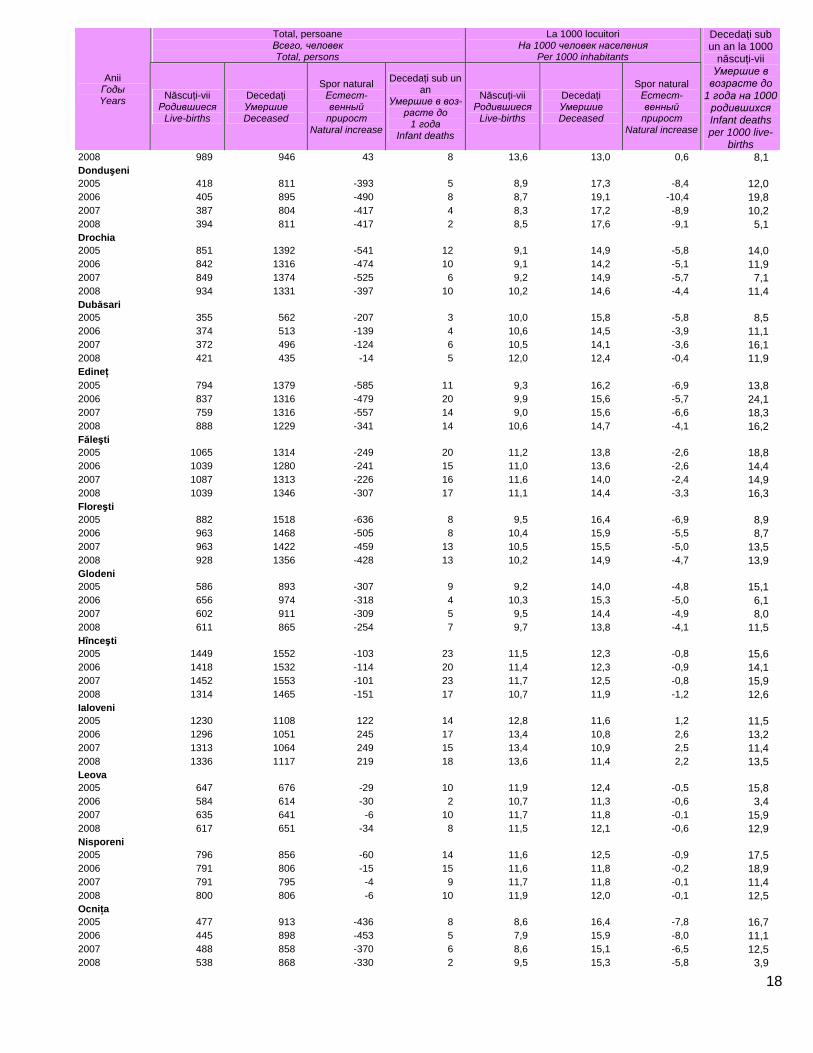
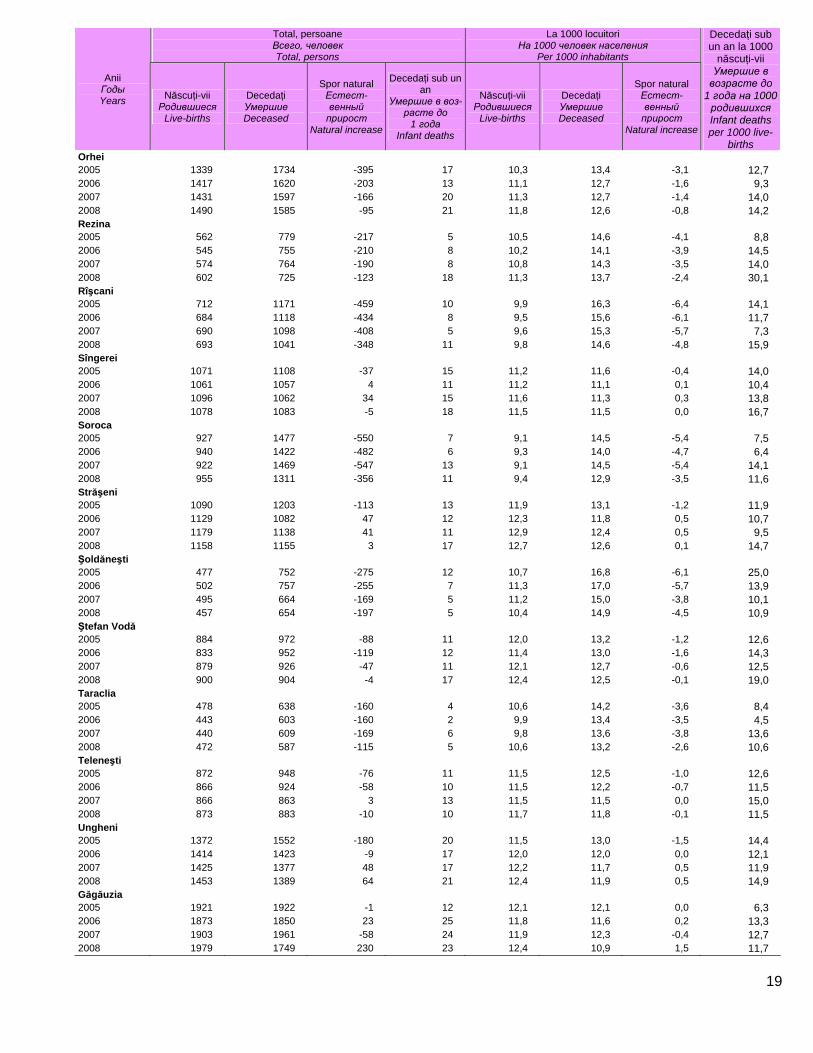
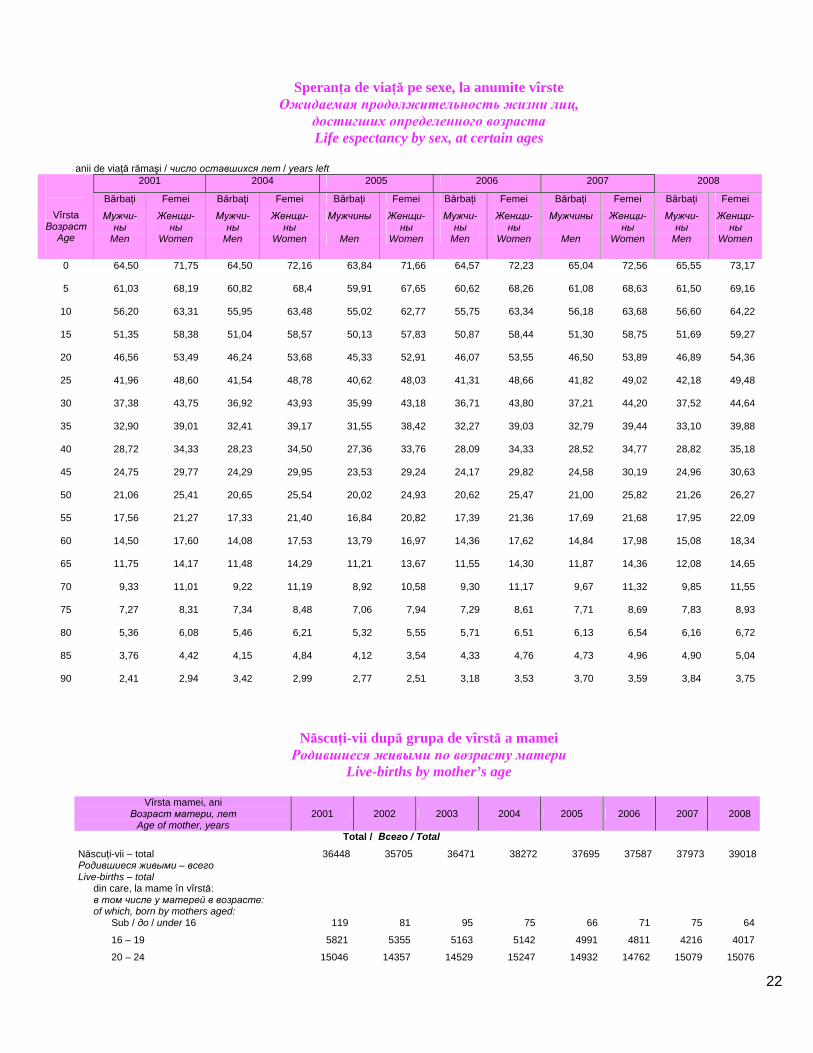
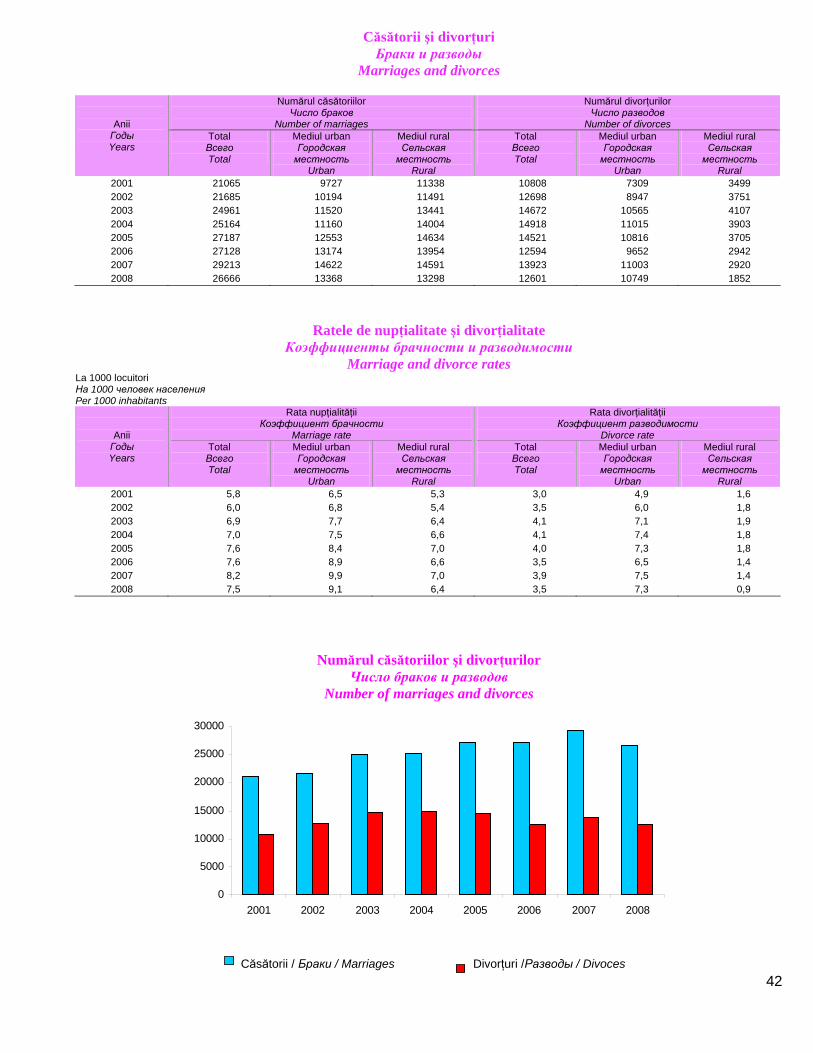
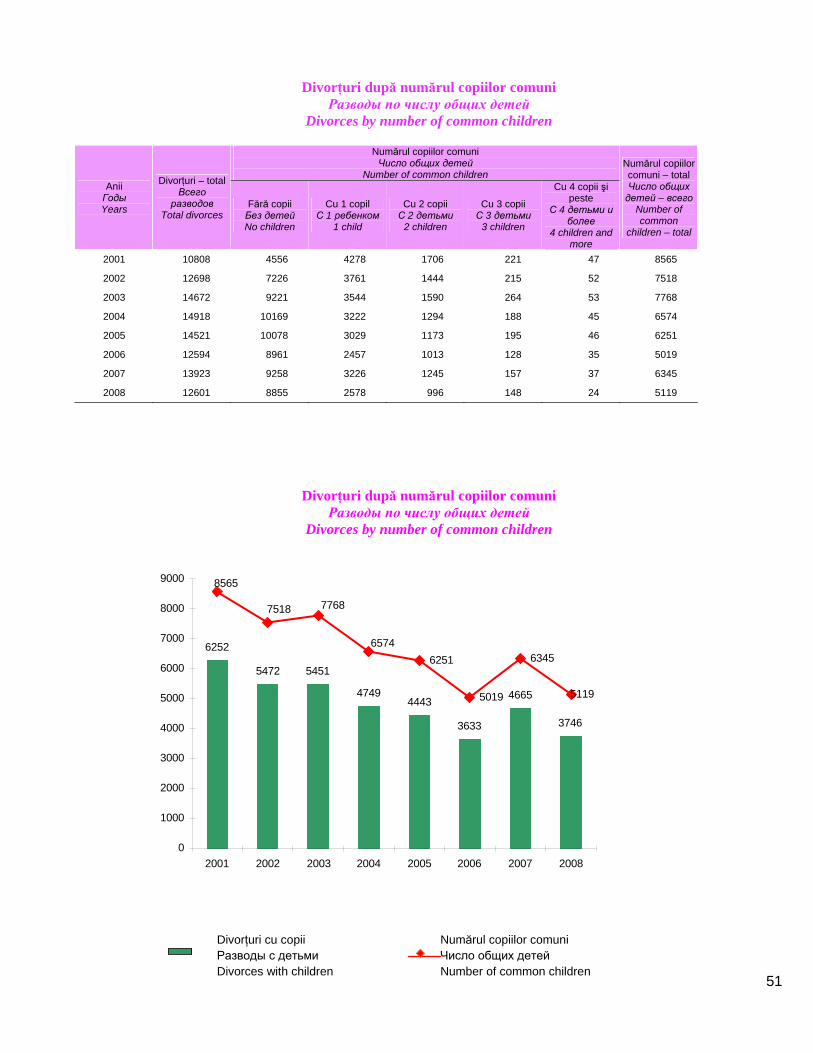
SUMAR Populaţia. Numărul populaţiei stabile al Republicii Moldova la 1ianuarie 2009 a fost de 3567,5 mii locuitori, din care 1476,1 mii (41,4%) – populaţia urbană şi 2091,4 mii (58,6%) – cea rurală, în scădere faţă de 1 ianuarie 2001, cu 67,6 mii persoane (inclusiv urbană cu 10,3 mii şi rurală cu 57,3 mii) Repartizarea populaţiei după sexe se prezintă astfel: 52,0% – femei şi 48,0% – bărbaţi. Structura populaţiei pe vîrste poartă amprenta caracteristică a unui proces de îmbătrînire demografică, adică creşterea ponderii femeilor şi bărbaţilor vîrstnici şi reducerea ponderii persoanelor în vîrstă de 0-14 ani. În ultimii opt ani s-a înregistrat reducerea ponderii acestei grupe de vîrstă de la 22,8% la 17,1% şi creşterea ponderii populaţiei vîrstnice (de 65 ani şi peste), de la 9,5% la 10,2%. Datorită nivelului înalt al mortalităţii bărbaţilor în vîrsta aptă de muncă procesul îmbătrînirii populaţiei în mai mare măsură este caracteristic pentru femei. Actualmente în structura populaţiei în vîrstă de 65 ani şi peste femeile constituie mai mult de 60%. Speranţa de viaţă la naştere în 2008 a fost de 69,4 ani, inclusiv la bărbaţi – 65,6, la femei – 73,2 ani. Comparativ cu 2001 ea s-a majorat, la bărbaţi cu un an, iar la femei aproximativ cu un an jumate. Evoluţia proceselor demografice se caracterizează prin următorii indicatori ai mişcării naturale a populaţiei: Rata natalităţii în 2008 a fost de 10,9 născuţi-vii la 1000 locuitori, în creştere faţă de cea din 2001 (10,0‰). Rata totală de fertilitate (numărul mediu de copii născuţi la 100 de femei de vîrsta 15-49 ani) a constituit 128 în 2008, cea mai mare din ultimii opt ani. Rata mortalităţii generale a scăzut în 2008 şi a constituit 11,8 decedaţi la 1000 locuitori, faţă de 12,4‰ în 2005. S-a păstrat decalajul dintre ratele de mortalitate din mediul urban şi mediul rural: 9,1‰ şi 13,6‰. Mortalitatea infantilă comparativ cu anul 2001 a scăzut de la 16,3 decedaţi în vîrstă sub 1 an la 1000 născuţi-vii pînă la 12,2 ‰. Căsătorii şi divorţuri. În ultimii opt ani se observă creşterea anuală atît a numărului căsătoriilor înregistrate, cît şi a divorţurilor. Rata nupţialităţii în această perioadă s-a majorat de la 5,8 căsătorii la 1000 locuitori pînă la 7,5, iar rata divorţialităţii - de la 3 pînă la 3,5 divorţuri la 1000 locuitori.
КРАТКОЕ ИЗЛОЖЕНИЕ ОСНОВНЫХ ПОКАЗАТЕЛЕЙ ДЕМОГРАФИЧЕСКОГО РАЗВИТИЯ Население Численность населения Республики Молдова на 1 января 2009 года составила 3567,5 тыс. человек, из которых 1476,1 тыс. (41,4%) проживало в городских поселениях и 2091,4 тыс. (58,6%) – в сельской местности. По сравнению с 2001 годом численность населения страны уменьшилась на 67,6 тыс. человек, в том числе городского – на 10,3 тыс. и сельского – на 57,3 тыс. Удельный вес женщин в общей численности составляет 52%, мужчин – 48%. Возрастная структура населения отражает продолжающуюся тенденцию к «постарению», т. е. увеличению доли женщин и мужчин в старших возрастах и сокращению доли лиц в возрасте 0-14 лет. За последние восемь лет отмечается снижение доли этой возрастной группы с 22,8% до 17,1% и рост удельного вес численности людей старших возрастов (65 лет старше) – с 9,5% до 10,2%. Вследствие высокого уровня смертности мужчин в трудоспособных возрастах процесс демографического старения населения в гораздо большей степени характерен для женщин. В настоящее время в структуре населения в возрасте 65 лет и более женщины составляют более 60%. Ожидаемая продолжительность жизни населения в 2008 году составила 69,4 лет, в том числе у мужчин – 65,6, у женщин -73,2. По сравнению с 2001 годом она увеличилась у мужчин на год, а у женщин почти на полтора года. Развитие демографических процессов характеризуется следующими основными показателями естественного движения населения: Коэффициент рождаемости составил в 2008 году 10,9 новорожденных в расчете на 1000 человек населения, против 10,0‰ в 2001 году. Суммарный коэффициент рождаемости (число родившихся детей в среднем на 100 женщин в возрасте 15-49 лет) составил 128 и является самым высоким за последние восемь лет. Общий коэффициент смертности снизился в 2008 году и составил 11,8 умерших в расчете на 1000 человек населения против 12,4‰ в 2005 году. Неизменным остается и значительный разрыв в показателях между городом и селом: 9,1‰ и 13,6‰ соответственно. Младенческая смертность по сравнению с 2001 годом снизилась с 16,3 умерших в возрасте до 1 года в расчете на 1000 родившихся до 12,2‰. Браки и разводы. За прошедшие восемь лет коэффициент брачности вырос с 5,8 браков в расчете на 1000 населения до 7,5, а коэффициент разводимости – с 3 разводов в расчете на 1000 жителей до 3,5.
SUMMARY
Population. The number of resident population of the Republic of Moldova at January 1st , 2009 constituted 3567,5 thou. inhabitants, of which 1476,1 thou. (41,4%) - urban population and 2091,4 thou. (58,6%) – rural population. In less that at January 1st, 2001 with 67,6 thou. persons (including urban - with 10,3 thou. and rural – with 57,3 thou.). The distribution of population by sex represents: women - 52%, men - 48%. The structure of population by age has the characteristic of a demographic ageing process, namely the increase of the share of old women and men and the decrease of the share of person aged 0-14 years. In the last 8 years was registered a diminuation of the share of this age group from 22,8% to 17,1% and increase of the share of old population (aged 65 years and over), from 9,5% to 10,2%. Because of the high mortality level of men of working age, the ageing population process is more typical to women. At present, in the structure of population aged 65 years and over, women represent more than 60%. The life expectancy at birth in 2008 was 69,4 year, including 65,6 year – men, 73,2 year – women. Compared to 2001, it increased with 1 year for men and approximately with half year for women.
5
The evolution of demographic processes is represented by the text indicators of the natural movement of population: Natality rate in 2008 was 10, 9 live-born per 1000 inhabitants, more than in 2001(10,0%). Total fertility rate (average number of children born per 100 women aged 15-49 years) in 2008 constituted 128, and is the highest for the past eight years. The mortality rate increased in 2008 and constituted to 11,8 deceases per 1000 inhabitants, given to 12,4 ‰ in 2005. The disparity between the mortality rate in urban and rural areas remained: 9, 1 ‰ and 13,6 ‰. Infant mortality, compared to the year 2001, decreased from 16,3 deceased, aged under 1 year per 1000 live-births, to 12,2 ‰. Marriages and divorces. In the last 8 years, the marriage rate increased from 5,8 marriages per 1000 inhabitants to 7,5, and divorciality rate – from 3 to 3,5 divorces per 1000 inhabitants.
6
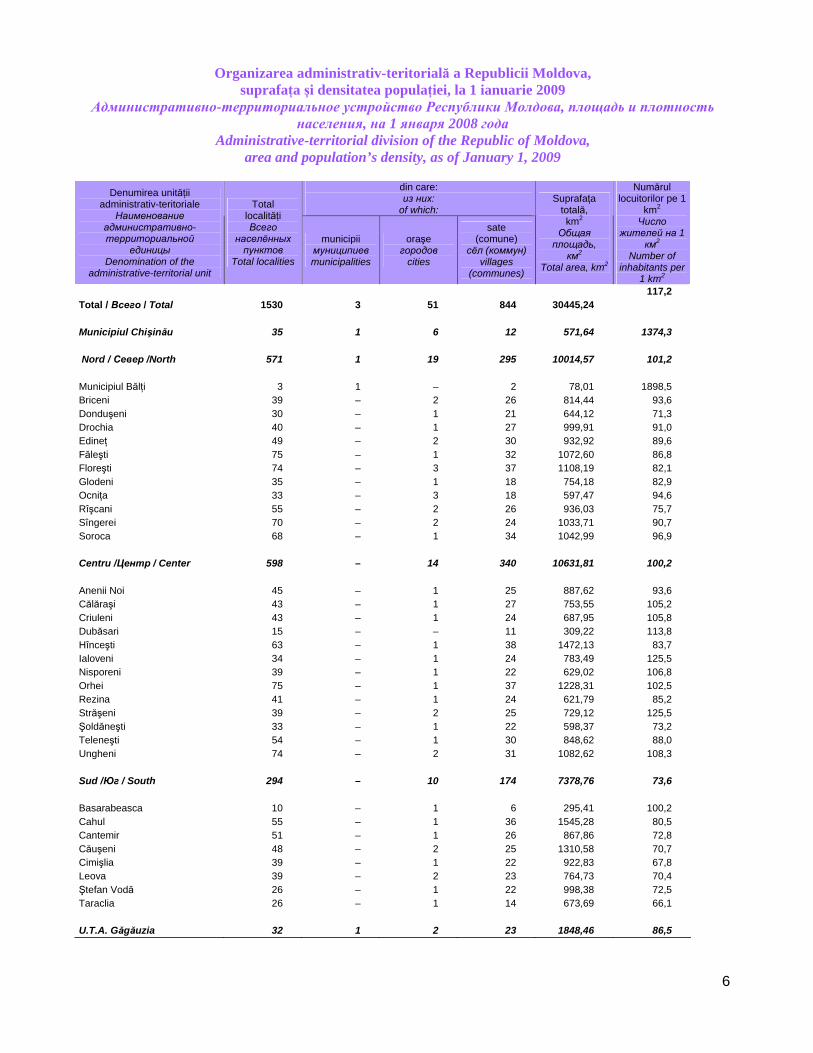
Organizarea administrativ-teritorială a Republicii Moldova, suprafaţa şi densitatea populaţiei, la 1 ianuarie 2009
Административно-территориальное устройство Республики Молдова, площадь и плотность населения, на 1 января 2008 года
Administrative-territorial division of the Republic of Moldova, area and population’s density, as of January 1, 2009
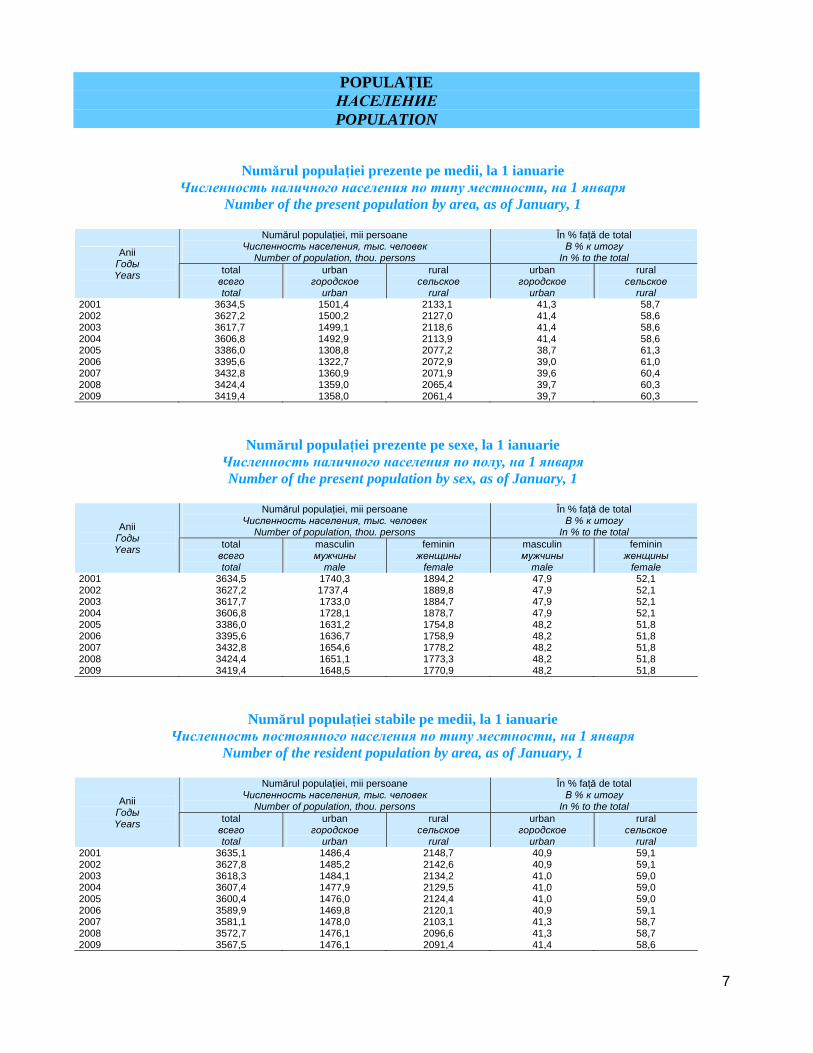
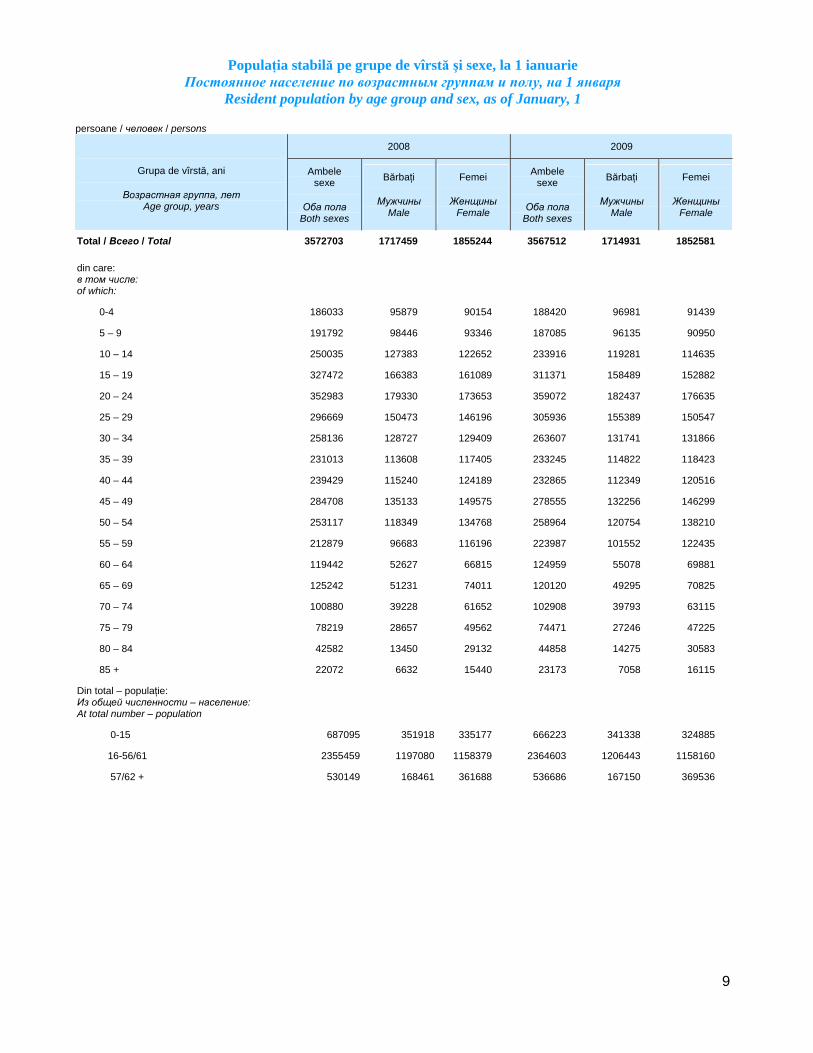
Numărul populaţiei prezente pe sexe, la 1 ianuarie Численность наличного населения по полу, на 1 января Number of the present population by sex, as of January, 1
Numărul populaţiei, mii persoane
Численность населения, тыс. человек Number of population, thou. persons
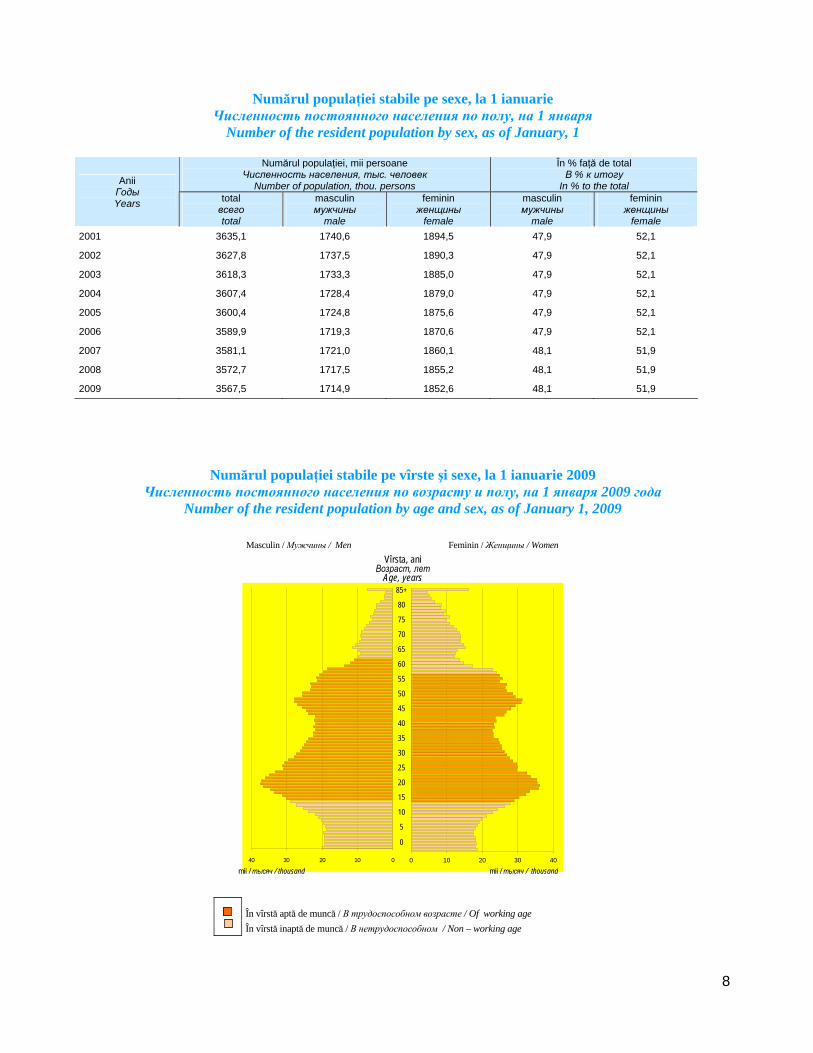
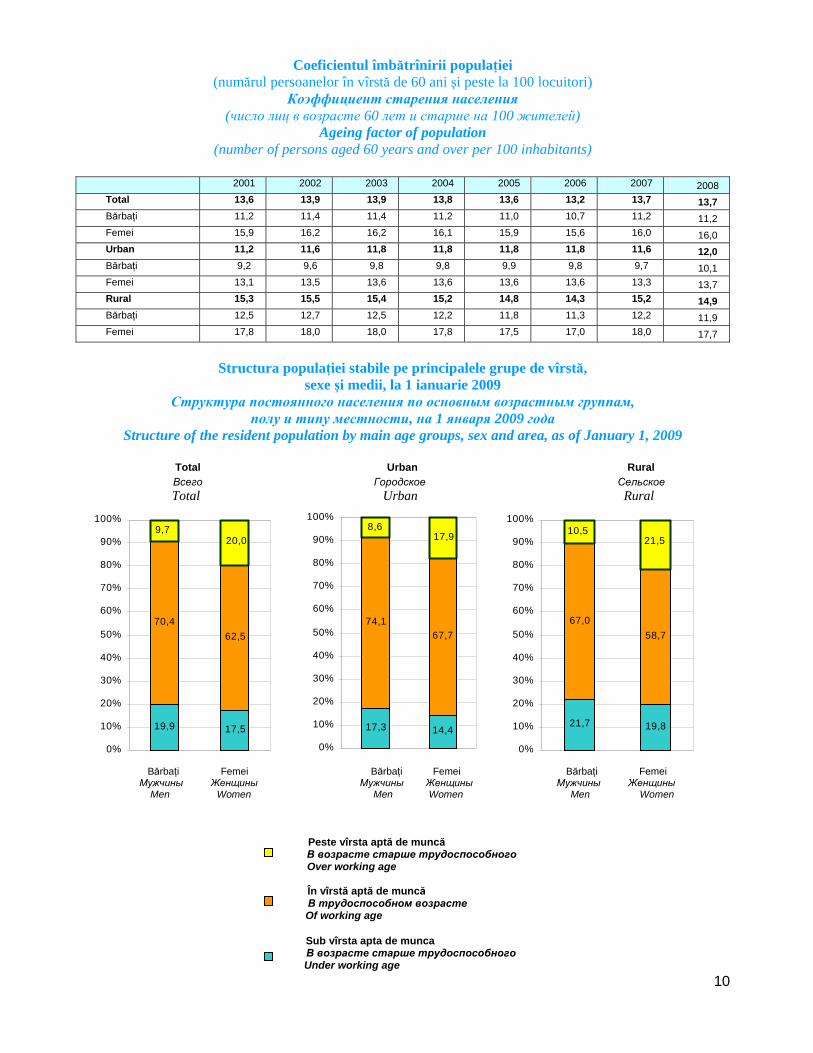
Structura populaţiei stabile pe principalele grupe de vîrstă,
sexe şi medii, la 1 ianuarie 2009 Структура постоянного населения по основным возрастным группам,
полу и типу местности, на 1 января 2009 года Structure of the resident population by main age groups, sex and area, as of January 1, 2009
Total Urban Rural Всего Городское Сельское Total Urban Rural
19,9 17,5
70,462,5
9,720,0
0%
10%
20%
30%
40%
50%
60%
70%
80%
90%
100%
17,3 14,4
74,167,7
8,617,9
0%
10%
20%
30%
40%
50%
60%
70%
80%
90%
100%
21,7 19,8
58,767,0
21,510,5
0%
10%
20%
30%
40%
50%
60%
70%
80%
90%
100%
Bărbaţi Femei Мужчины Женщины Men Women
Bărbaţi Femei Мужчины Женщины
Men Women
Bărbaţi Femei Мужчины Женщины Men Women
Peste vîrsta aptă de muncă В возрасте старше трудоспособного Over working age
În vîrstă aptă de muncă В трудоспособном возрасте Of working age
Sub vîrsta apta de munca В возрасте старше трудоспособного Under working age
11
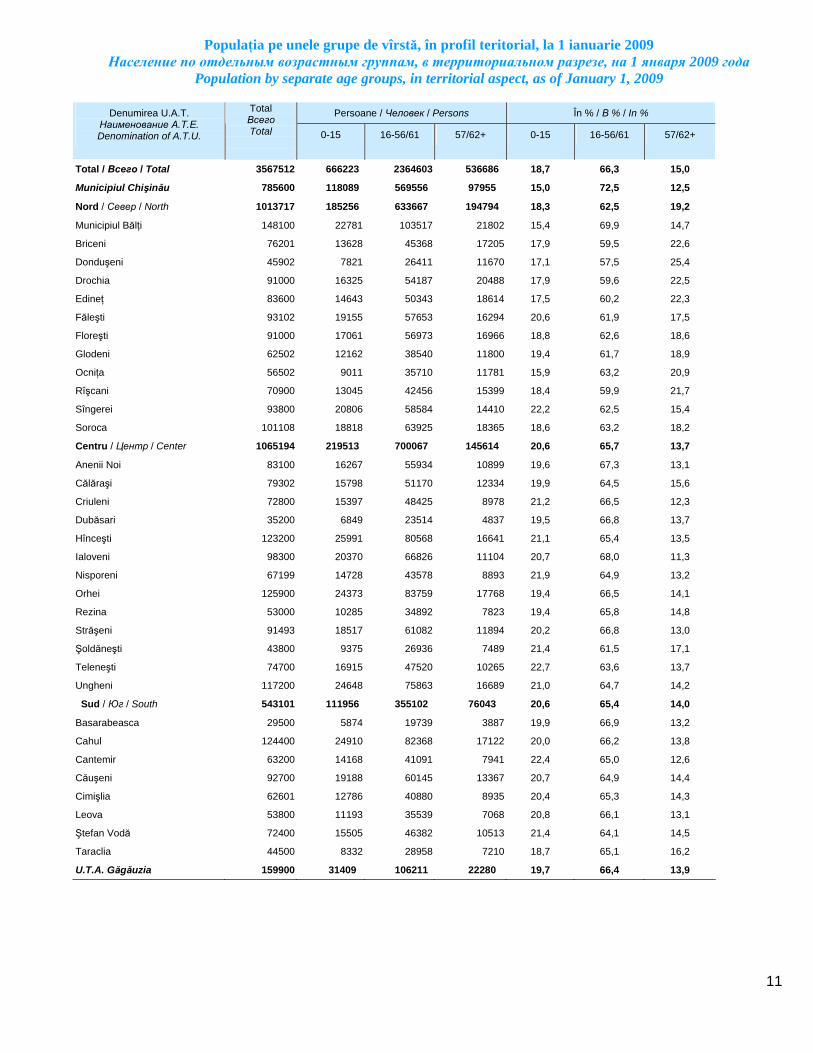
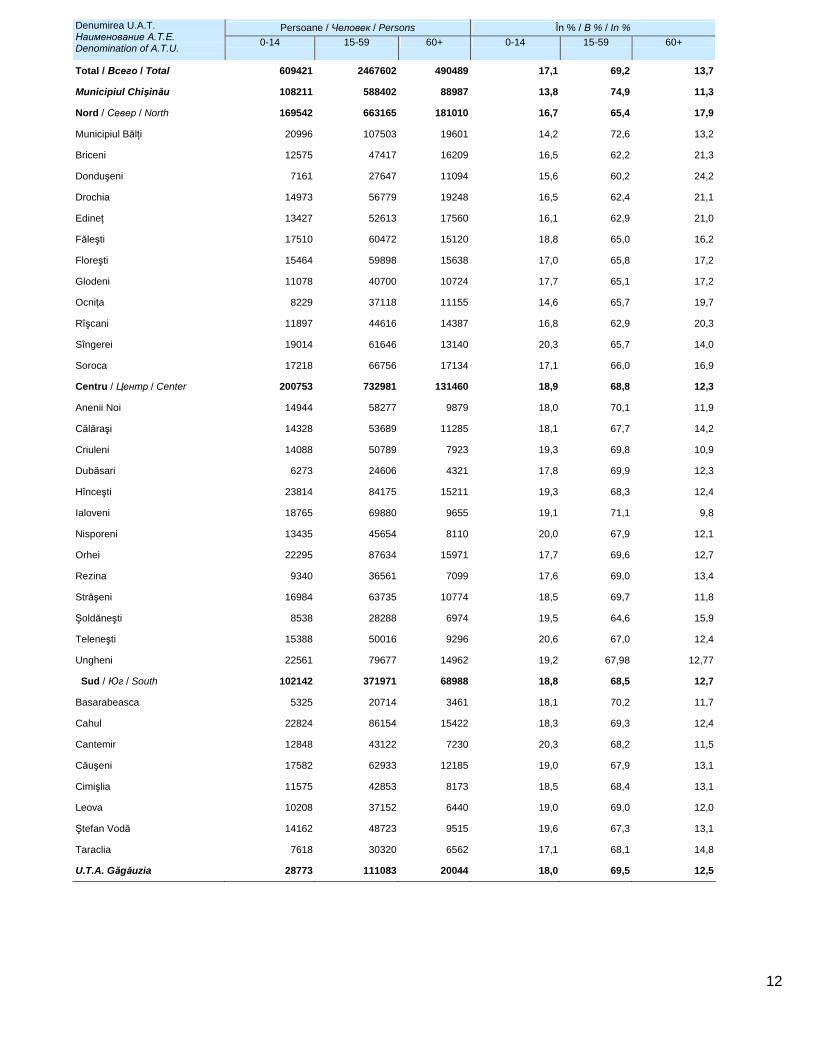
Populaţia pe unele grupe de vîrstă, în profil teritorial, la 1 ianuarie 2009 Население по отдельным возрастным группам, в территориальном разрезе, на 1 января 2009 года
Population by separate age groups, in territorial aspect, as of January 1, 2009
Persoane / Человек / Persons În % / В % / In % Denumirea U.A.T. Наименование А.Т.Е. Denomination of A.T.U.
Total Всего Total
0-15 16-56/61 57/62+ 0-15 16-56/61 57/62+
Total / Всего / Total 3567512 666223 2364603 536686 18,7 66,3 15,0
Municipiul Chişinău 785600 118089 569556 97955 15,0 72,5 12,5
Nord / Север / North 1013717 185256 633667 194794 18,3 62,5 19,2
Municipiul Bălţi 148100 22781 103517 21802 15,4 69,9 14,7
Briceni 76201 13628 45368 17205 17,9 59,5 22,6
Donduşeni 45902 7821 26411 11670 17,1 57,5 25,4
Drochia 91000 16325 54187 20488 17,9 59,6 22,5
Edineţ 83600 14643 50343 18614 17,5 60,2 22,3
Făleşti 93102 19155 57653 16294 20,6 61,9 17,5
Floreşti 91000 17061 56973 16966 18,8 62,6 18,6
Glodeni 62502 12162 38540 11800 19,4 61,7 18,9
Ocniţa 56502 9011 35710 11781 15,9 63,2 20,9
Rîşcani 70900 13045 42456 15399 18,4 59,9 21,7
Sîngerei 93800 20806 58584 14410 22,2 62,5 15,4
Soroca 101108 18818 63925 18365 18,6 63,2 18,2
Centru / Центр / Center 1065194 219513 700067 145614 20,6 65,7 13,7
Anenii Noi 83100 16267 55934 10899 19,6 67,3 13,1
Călăraşi 79302 15798 51170 12334 19,9 64,5 15,6
Criuleni 72800 15397 48425 8978 21,2 66,5 12,3
Dubăsari 35200 6849 23514 4837 19,5 66,8 13,7
Hînceşti 123200 25991 80568 16641 21,1 65,4 13,5
Ialoveni 98300 20370 66826 11104 20,7 68,0 11,3
Nisporeni 67199 14728 43578 8893 21,9 64,9 13,2
Orhei 125900 24373 83759 17768 19,4 66,5 14,1
Rezina 53000 10285 34892 7823 19,4 65,8 14,8
Străşeni 91493 18517 61082 11894 20,2 66,8 13,0
Şoldăneşti 43800 9375 26936 7489 21,4 61,5 17,1
Teleneşti 74700 16915 47520 10265 22,7 63,6 13,7
Ungheni 117200 24648 75863 16689 21,0 64,7 14,2
Sud / Юг / South 543101 111956 355102 76043 20,6 65,4 14,0
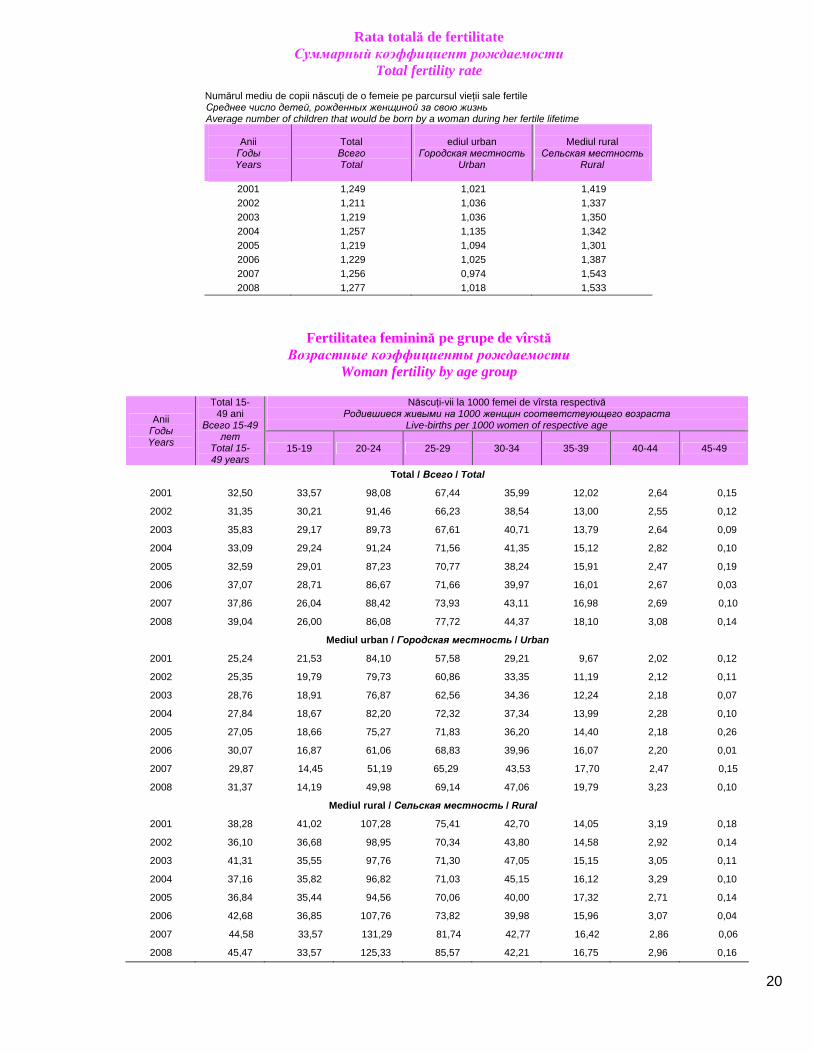
Rata totală de fertilitate Суммарный коэффициент рождаемости
Total fertility rate
Numărul mediu de copii născuţi de o femeie pe parcursul vieţii sale fertile Среднее число детей, рожденных женщиной за свою жизнь Average number of children that would be born by a woman during her fertile lifetime
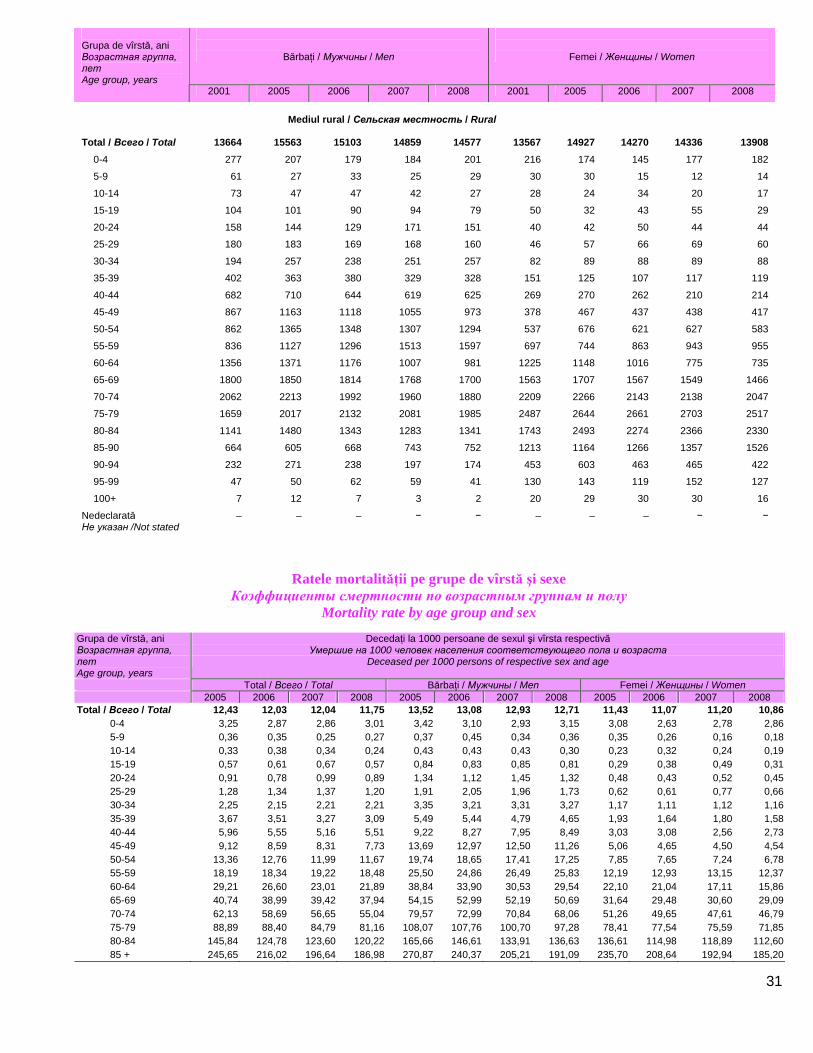
Ratele mortalităţii pe grupe de vîrstă şi sexe Коэффициенты смертности по возрастным группам и полу
Mortality rate by age group and sex
Grupa de vîrstă, ani Возрастная группа, лет Age group, years
Decedaţi la 1000 persoane de sexul şi vîrsta respectivă Умершие на 1000 человек населения соответствующего пола и возраста
Deceased per 1000 persons of respective sex and age
Total / Всего / Total Bărbaţi / Мужчины / Men Femei / Женщины / Women 2005 2006 2007 2008 2005 2006 2007 2008 2005 2006 2007 2008 Total / Всего / Total 12,43 12,03 12,04 11,75 13,52 13,08 12,93 12,71 11,43 11,07 11,20 10,86
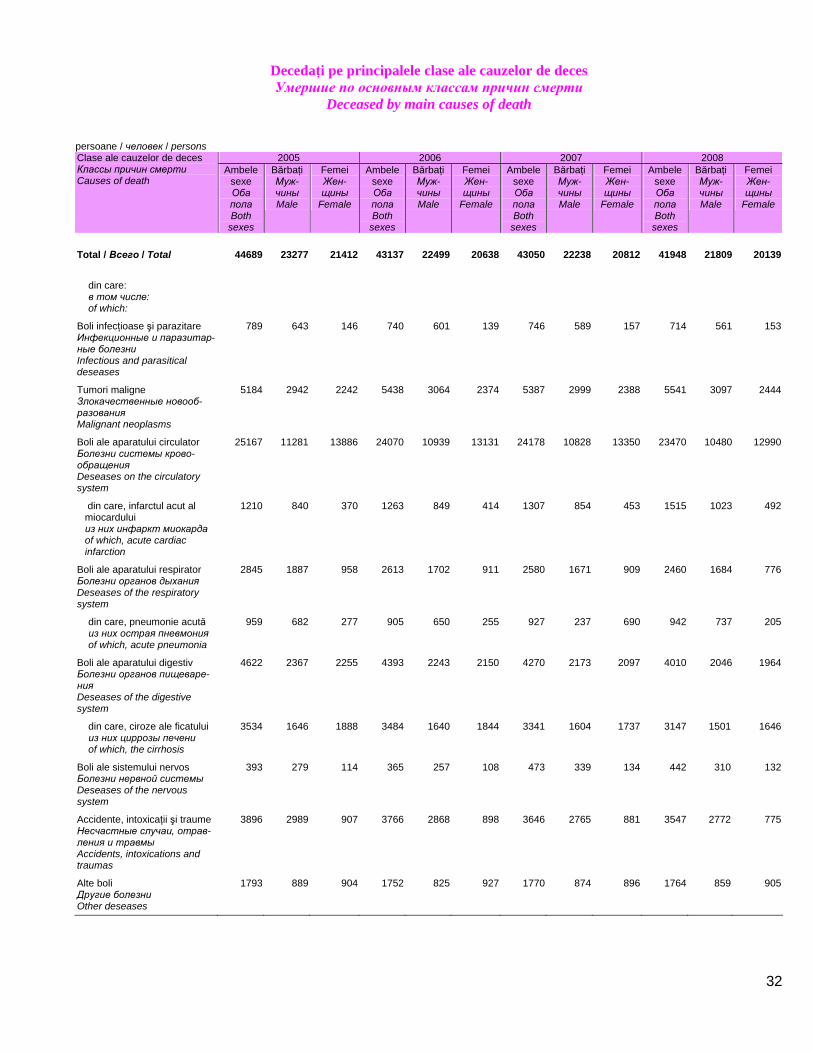
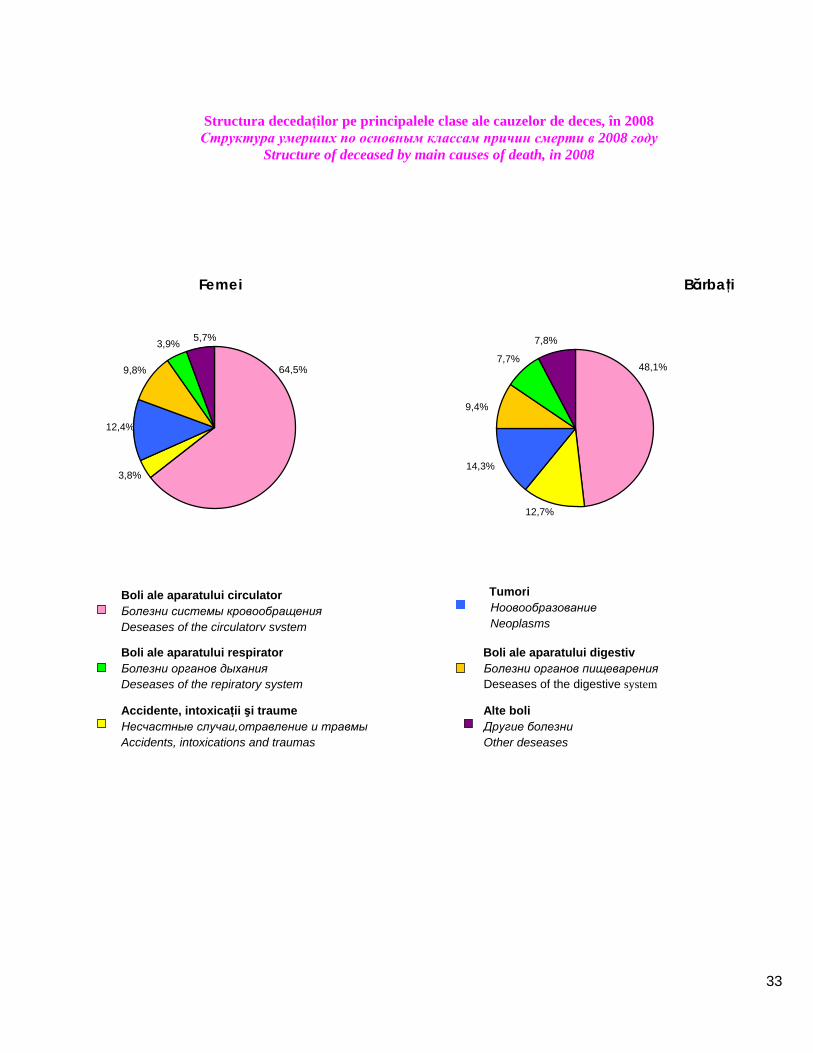
Structura decedaţilor pe principalele clase ale cauzelor de deces, în 2008 Структура умерших по основным классам причин смерти в 2008 году
Structure of deceased by main causes of death, in 2008
Femei Bărbaţi
3,8%
9,8% 64,5%
3,9%
12,4%
5,7%
7,7%
7,8%
12,7%
14,3%
9,4%
48,1%
Boli ale aparatului circulator Болезни системы кровообращения Deseases of the circulatory system
Alte boli Другие болезни Other deseases
Boli ale aparatului respirator Болезни органов дыхания Deseases of the repiratory system
Boli ale aparatului digestiv Болезни органов пищеварения Deseases of the digestive system
Accidente, intoxicaţii şi traume Несчастные случаи,отравление и травмыAccidents, intoxications and traumas
Tumori Ноовообразование Neoplasms
34
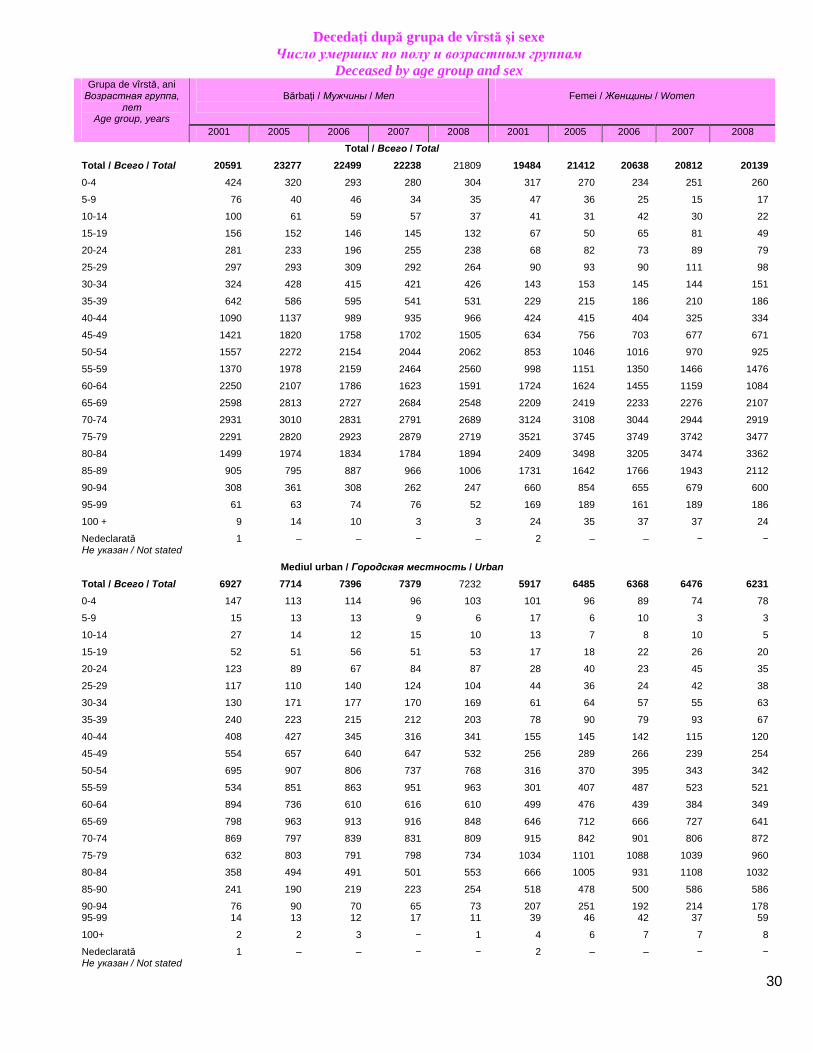
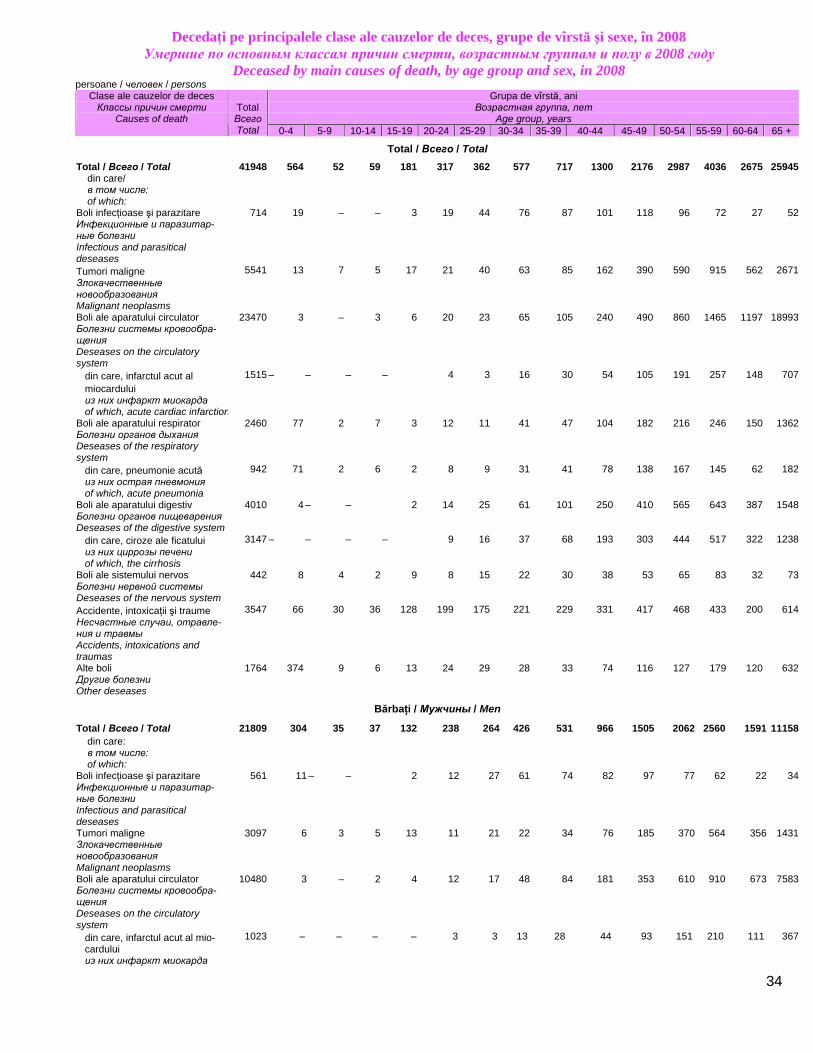
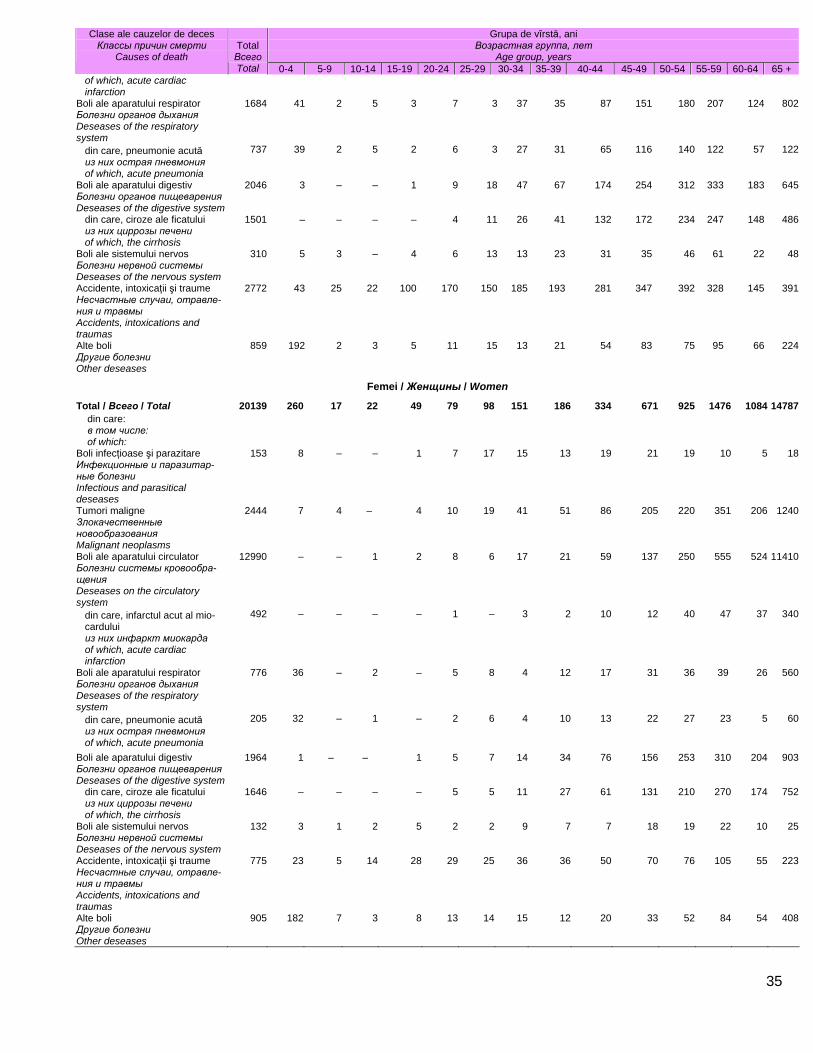
Decedaţi pe principalele clase ale cauzelor de deces, grupe de vîrstă şi sexe, în 2008 Умершие по основным классам причин смерти, возрастным группам и полу в 2008 году
Deceased by main causes of death, by age group and sex, in 2008 persoane / человек / persons
Grupa de vîrstă, ani Возрастная группа, лет
Age group, years
Clase ale cauzelor de deces Классы причин смерти
Causes of death
Total Всего Total 0-4 5-9 10-14 15-19 20-24 25-29 30-34 35-39 40-44 45-49 50-54 55-59 60-64 65 +
Total / Всего / Total
Total / Всего / Total 41948 564 52 59 181 317 362 577 717 1300 2176 2987 4036 2675 25945 din care/ в том числе: of which:
Boli infecţioase şi parazitare Инфекционные и паразитар-ные болезни Infectious and parasitical deseases
Boli ale aparatului circulator Болезни системы кровообра-щения Deseases on the circulatory system
12990 – – 1 2 8 6 17 21 59 137 250 555 524 11410
din care, infarctul acut al mio-cardului из них инфаркт миокарда of which, acute cardiac infarction
492 – – – – 1 – 3 2 10 12 40 47 37 340
Boli ale aparatului respirator Болезни органов дыхания Deseases of the respiratory system
776 36 – 2 – 5 8 4 12 17 31 36 39 26 560
din care, pneumonie acută из них острая пневмония of which, acute pneumonia
205 32 – 1 – 2 6 4 10 13 22 27 23 5 60
Boli ale aparatului digestiv Болезни органов пищеварения Deseases of the digestive system
1964 1 – – 1 5 7 14 34 76 156 253 310 204 903
din care, ciroze ale ficatului из них циррозы печени of which, the cirrhosis
1646 – – – – 5 5 11 27 61 131 210 270 174 752
Boli ale sistemului nervos Болезни нервной системы Deseases of the nervous system
132 3 1 2 5 2 2 9 7 7 18 19 22 10 25
Accidente, intoxicaţii şi traume Несчастные случаи, отравле-ния и травмы Accidents, intoxications and traumas
775 23 5 14 28 29 25 36 36 50 70 76 105 55 223
Alte boli Другие болезни Other deseases
905 182 7 3 8 13 14 15 12 20 33 52 84 54 408
36
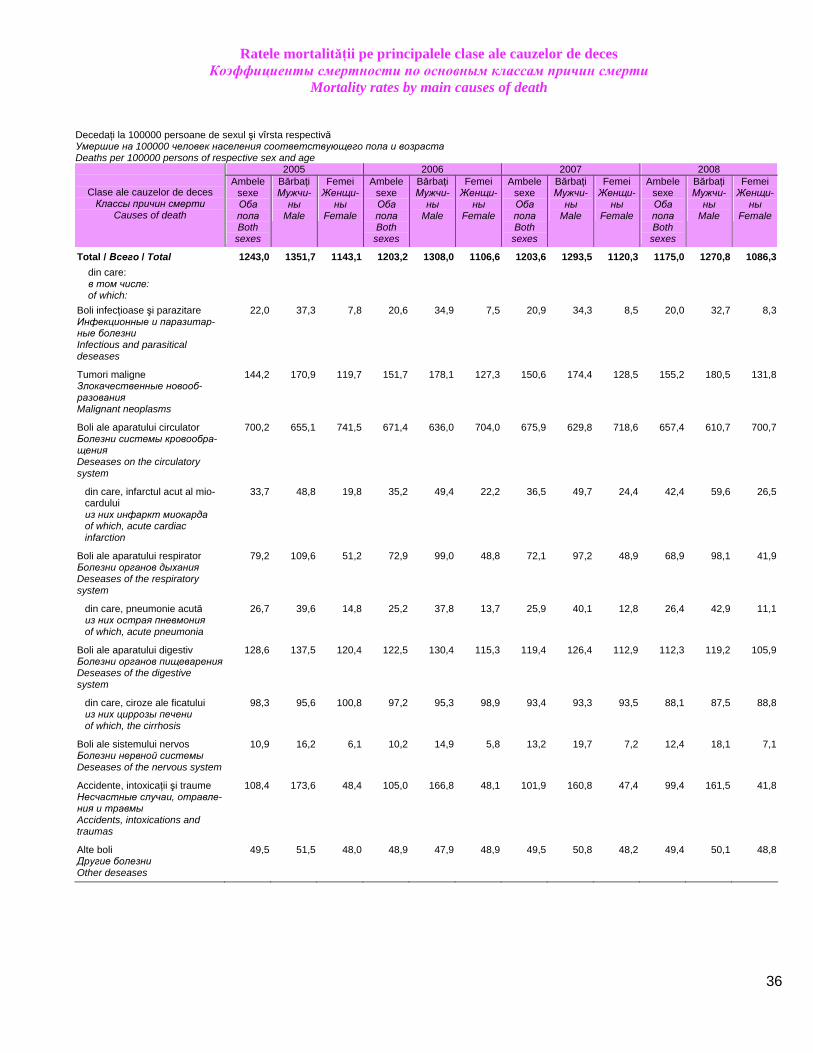
Ratele mortalităţii pe principalele clase ale cauzelor de deces
Коэффициенты смертности по основным классам причин смерти Mortality rates by main causes of death
Decedaţi la 100000 persoane de sexul şi vîrsta respectivă Умершие на 100000 человек населения соответствующего пола и возраста Deaths per 100000 persons of respective sex and age
2005 2006 2007 2008
Clase ale cauzelor de deces Классы причин смерти
Causes of death
Ambele sexe Оба пола Both
sexes
Bărbaţi Мужчи-ны
Male
FemeiЖенщи-
ны Female
Ambele sexe Оба пола Both
sexes
BărbaţiМужчи-ны
Male
FemeiЖенщи-
ны Female
Ambele sexe Оба пола Both
sexes
Bărbaţi Мужчи-ны
Male
Femei Женщи-
ны Female
Ambele sexe Оба пола Both
sexes
BărbaţiМужчи-ны
Male
FemeiЖенщи-
ны Female
Total / Всего / Total 1243,0 1351,7 1143,1 1203,2 1308,0 1106,6 1203,6 1293,5 1120,3 1175,0 1270,8 1086,3 din care: в том числе: of which:
Boli infecţioase şi parazitare Инфекционные и паразитар-ные болезни Infectious and parasitical deseases
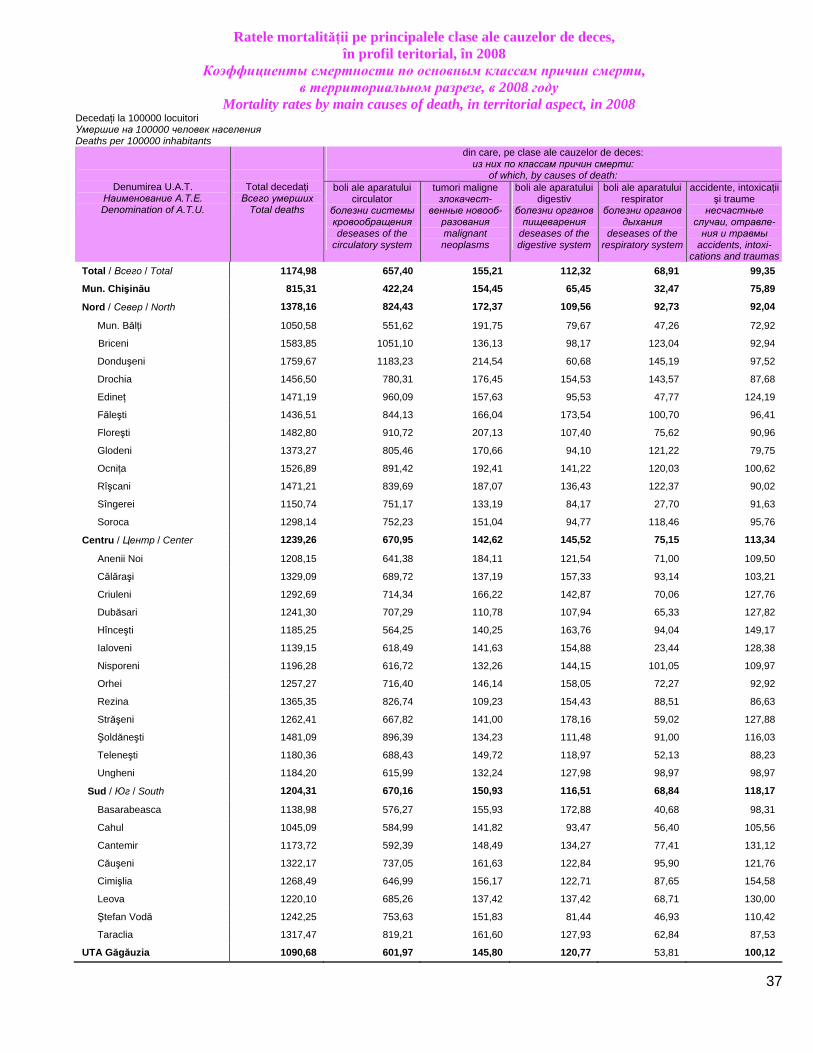
Ratele mortalităţii pe principalele clase ale cauzelor de deces, în profil teritorial, în 2008
Коэффициенты смертности по основным классам причин смерти, в территориальном разрезе, в 2008 году
Mortality rates by main causes of death, in territorial aspect, in 2008 Decedaţi la 100000 locuitori Умершие на 100000 человек населения Deaths per 100000 inhabitants
din care, pe clase ale cauzelor de deces: из них по классам причин смерти:
of which, by causes of death:
Denumirea U.A.T. Наименование А.Т.Е. Denomination of A.T.U.
Total decedaţi Всего умерших
Total deaths
boli ale aparatului circulator
болезни системы кровообращенияdeseases of the
circulatory system
tumori maligne злокачест-
венные новооб-разования malignant neoplasms
boli ale aparatului digestiv
болезни органов пищеварения
deseases of the digestive system
boli ale aparatului respirator
болезни органов дыхания
deseases of the respiratory system
accidente, intoxicaţii şi traume
несчастные случаи, отравле-ния и травмы
accidents, intoxi-cations and traumas
Total / Всего / Total 1174,98 657,40 155,21 112,32 68,91 99,35
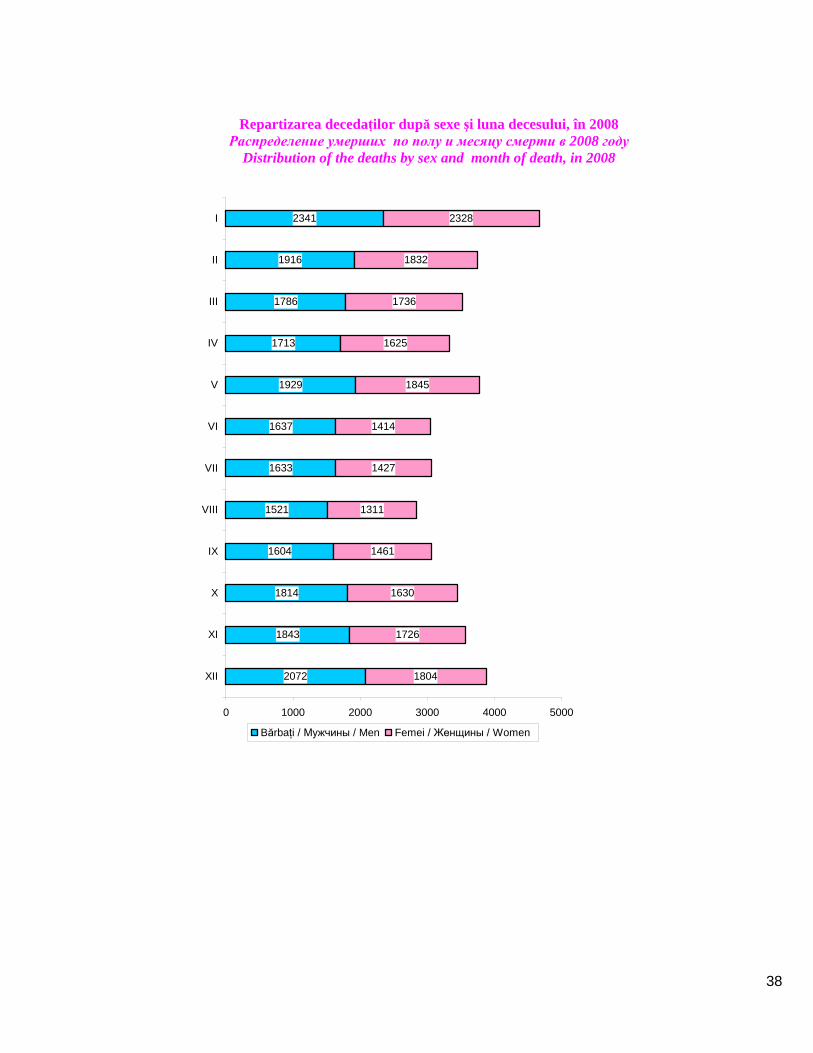
Repartizarea decedaţilor după sexe şi luna decesului, în 2008 Распределение умерших по полу и месяцу смерти в 2008 году
Distribution of the deaths by sex and month of death, in 2008
2072
1843
1814
1604
1521
1633
1637
1929
1713
1786
1916
2341
1804
1726
1630
1461
1311
1427
1414
1845
1625
1736
1832
2328
0 1000 2000 3000 4000 5000
XII
XI
X
IX
VIII
VII
VI
V
IV
III
II
I
Bărbaţi / Мужчины / Men Femei / Женщины / Women
39
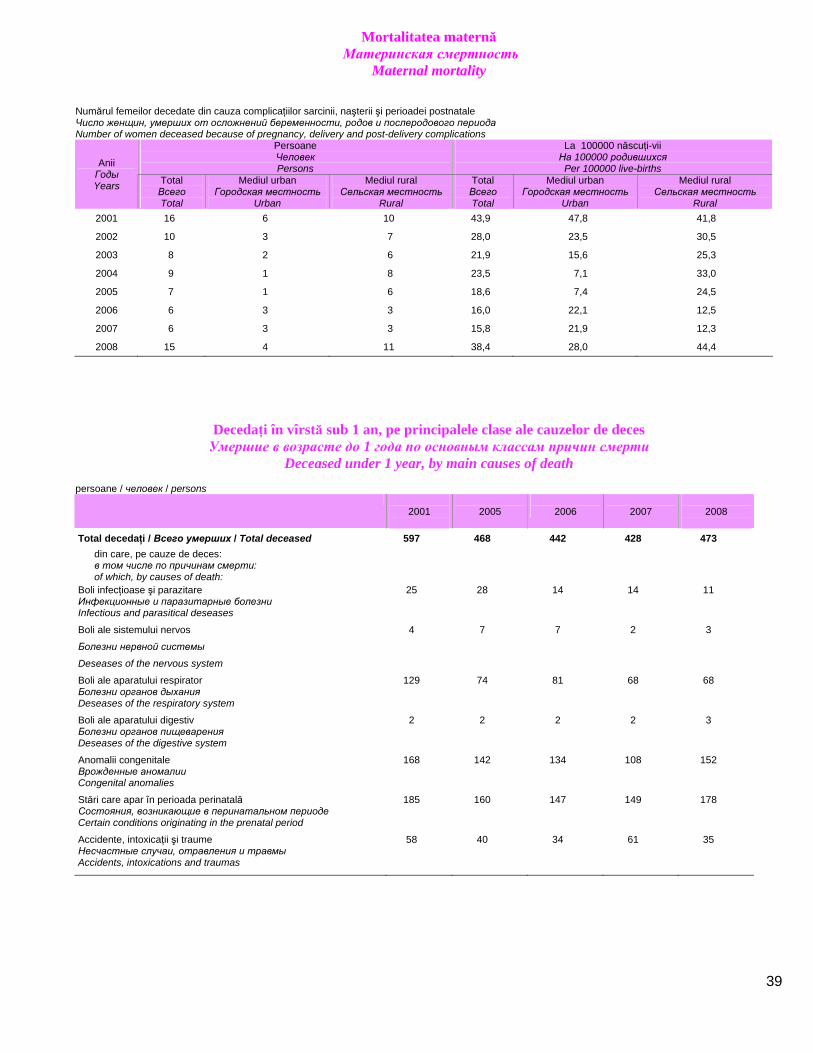
Mortalitatea maternă Материнская смертность
Maternal mortality
Numărul femeilor decedate din cauza complicaţiilor sarcinii, naşterii şi perioadei postnatale Число женщин, умерших от осложнений беременности, родов и послеродового периода Number of women deceased because of pregnancy, delivery and post-delivery complications
Persoane Человек Persons
La 100000 născuţi-vii На 100000 родившихся Per 100000 live-births Anii
Годы Years Total
Всего Total
Mediul urban Городская местность
Urban
Mediul rural Сельская местность
Rural
Total Всего Total
Mediul urban Городская местность
Urban
Mediul rural Сельская местность
Rural 2001 16 6 10 43,9 47,8 41,8
2002 10 3 7 28,0 23,5 30,5
2003 8 2 6 21,9 15,6 25,3
2004 9 1 8 23,5 7,1 33,0
2005 7 1 6 18,6 7,4 24,5
2006 6 3 3 16,0 22,1 12,5
2007 6 3 3 15,8 21,9 12,3
2008 15 4 11 38,4 28,0 44,4
Decedaţi în vîrstă sub 1 an, pe principalele clase ale cauzelor de deces Умершие в возрасте до 1 года по основным классам причин смерти
Deceased under 1 year, by main causes of death persoane / человек / persons
2001
2005
2006
2007
2008
Total decedaţi / Всего умерших / Total deceased 597 468 442 428 473
din care, pe cauze de deces: в том числе по причинам смерти: of which, by causes of death:
Boli infecţioase şi parazitare Инфекционные и паразитарные болезни Infectious and parasitical deseases
25 28 14 14 11
Boli ale sistemului nervos
Болезни нервной системы
Deseases of the nervous system
4 7 7 2 3
Boli ale aparatului respirator Болезни органов дыхания Deseases of the respiratory system
129 74 81 68 68
Boli ale aparatului digestiv Болезни органов пищеварения Deseases of the digestive system
Stări care apar în perioada perinatală Состояния, возникающие в перинатальном периоде Certain conditions originating in the prenatal period
185 160 147 149 178
Accidente, intoxicaţii şi traume Несчастные случаи, отравления и травмы Accidents, intoxications and traumas
58 40 34
61 35
40
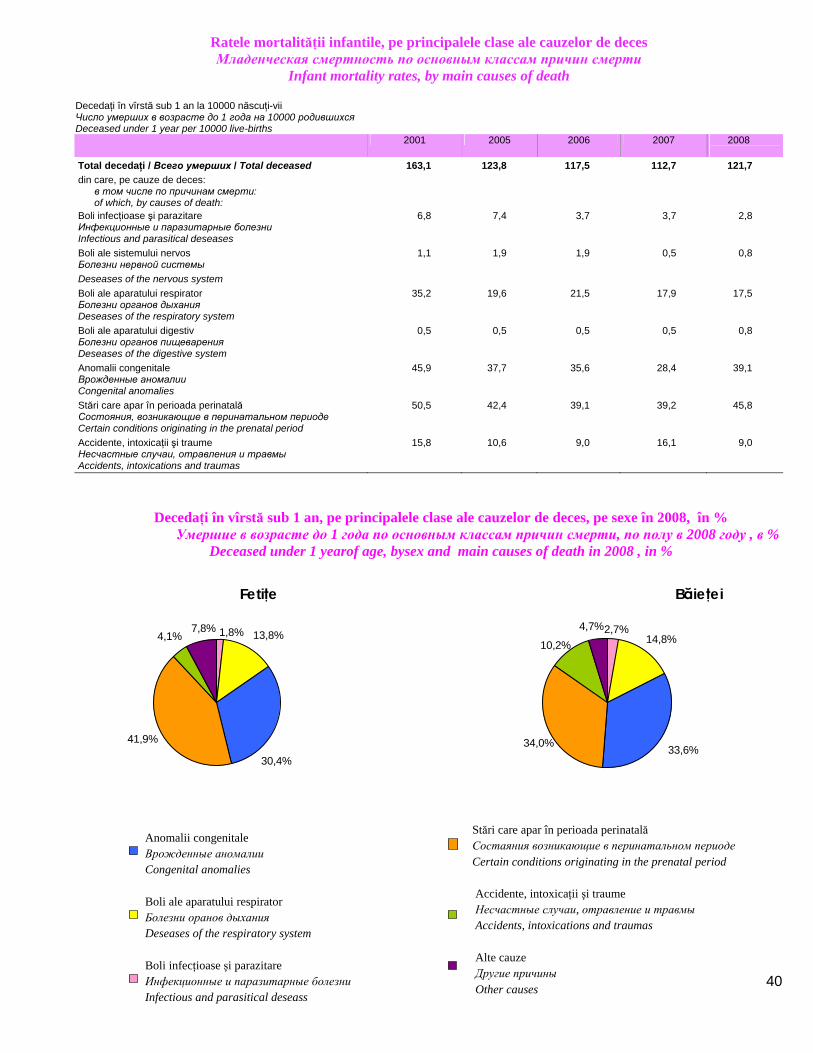
Ratele mortalităţii infantile, pe principalele clase ale cauzelor de deces Младенческая смертность по основным классам причин смерти
Infant mortality rates, by main causes of death
Decedaţi în vîrstă sub 1 an la 10000 născuţi-vii Число умерших в возрасте до 1 года на 10000 родившихся Deceased under 1 year per 10000 live-births 2001 2005 2006 2007 2008
Total decedaţi / Всего умерших / Total deceased 163,1 123,8 117,5 112,7 121,7 din care, pe cauze de deces:
в том числе по причинам смерти: of which, by causes of death:
Boli infecţioase şi parazitare Инфекционные и паразитарные болезни Infectious and parasitical deseases
6,8 7,4 3,7 3,7 2,8
Boli ale sistemului nervos Болезни нервной системы Deseases of the nervous system
1,1 1,9 1,9 0,5 0,8
Boli ale aparatului respirator Болезни органов дыхания Deseases of the respiratory system
35,2 19,6 21,5 17,9 17,5
Boli ale aparatului digestiv Болезни органов пищеварения Deseases of the digestive system
Stări care apar în perioada perinatală Состояния, возникающие в перинатальном периоде Certain conditions originating in the prenatal period
50,5 42,4 39,1 39,2 45,8
Accidente, intoxicaţii şi traume Несчастные случаи, отравления и травмы Accidents, intoxications and traumas
15,8 10,6 9,0 16,1 9,0
Decedaţi în vîrstă sub 1 an, pe principalele clase ale cauzelor de deces, pe sexe în 2008, în % Умершие в возрасте до 1 года по основным классам причин смерти, по полу в 2008 году , в %
Deceased under 1 yearof age, bysex and main causes of death in 2008 , in %
Boli ale aparatului respirator Болезни оранов дыхания Deseases of the respiratory system Boli infecţioase şi parazitare Инфекционные и паразитарные болезни Infectious and parasitical deseass
Alte cauze Другие причины Other causes
Accidente, intoxicaţii şi traume Несчастные случаи, отравление и травмы Accidents, intoxications and traumas
Stări care apar în perioada perinatală Состаяния возникающие в перинатальном периодеCertain conditions originating in the prenatal period
41
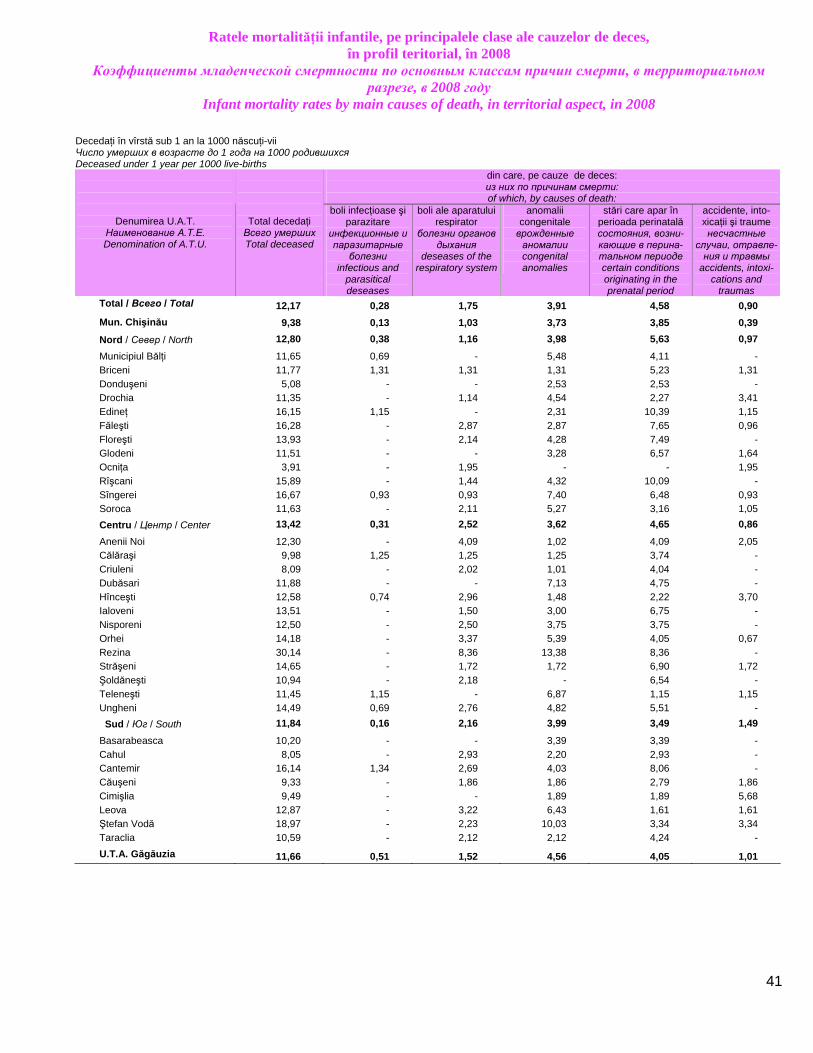
Ratele mortalităţii infantile, pe principalele clase ale cauzelor de deces, în profil teritorial, în 2008
Коэффициенты младенческой смертности по основным классам причин смерти, в территориальном разрезе, в 2008 году
Infant mortality rates by main causes of death, in territorial aspect, in 2008 Decedaţi în vîrstă sub 1 an la 1000 născuţi-vii Число умерших в возрасте до 1 года на 1000 родившихся Deceased under 1 year per 1000 live-births
din care, pe cauze de deces: из них по причинам смерти: of which, by causes of death:
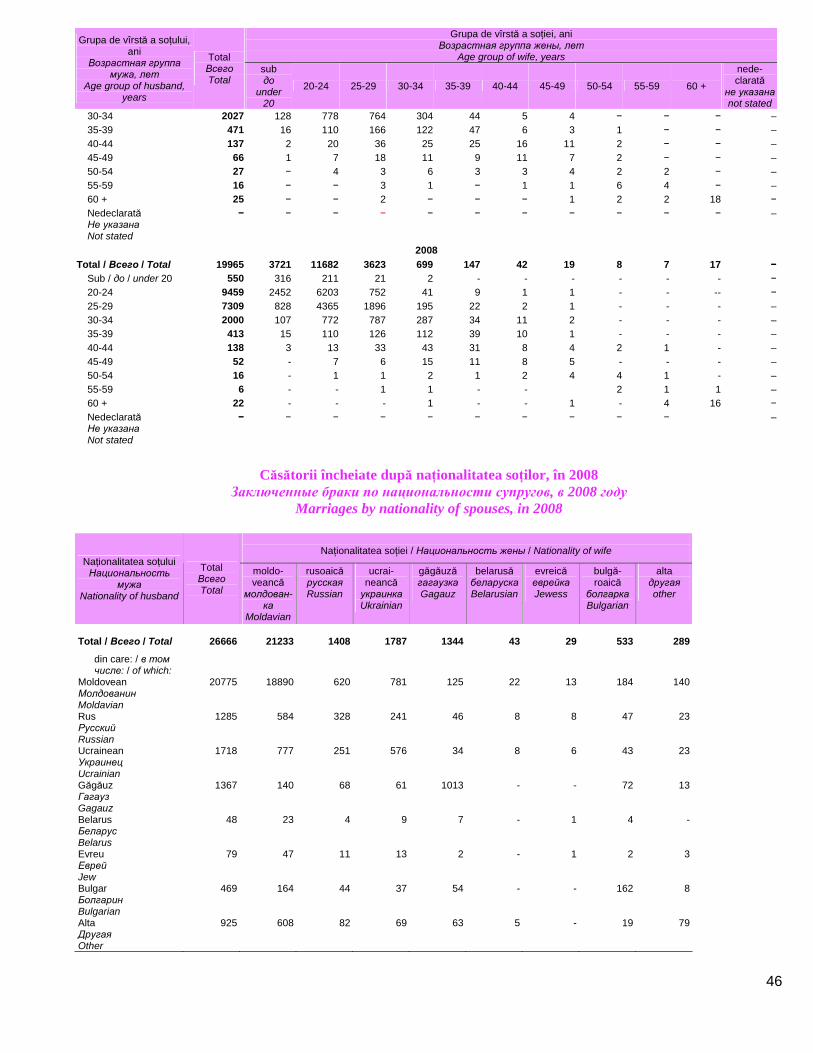
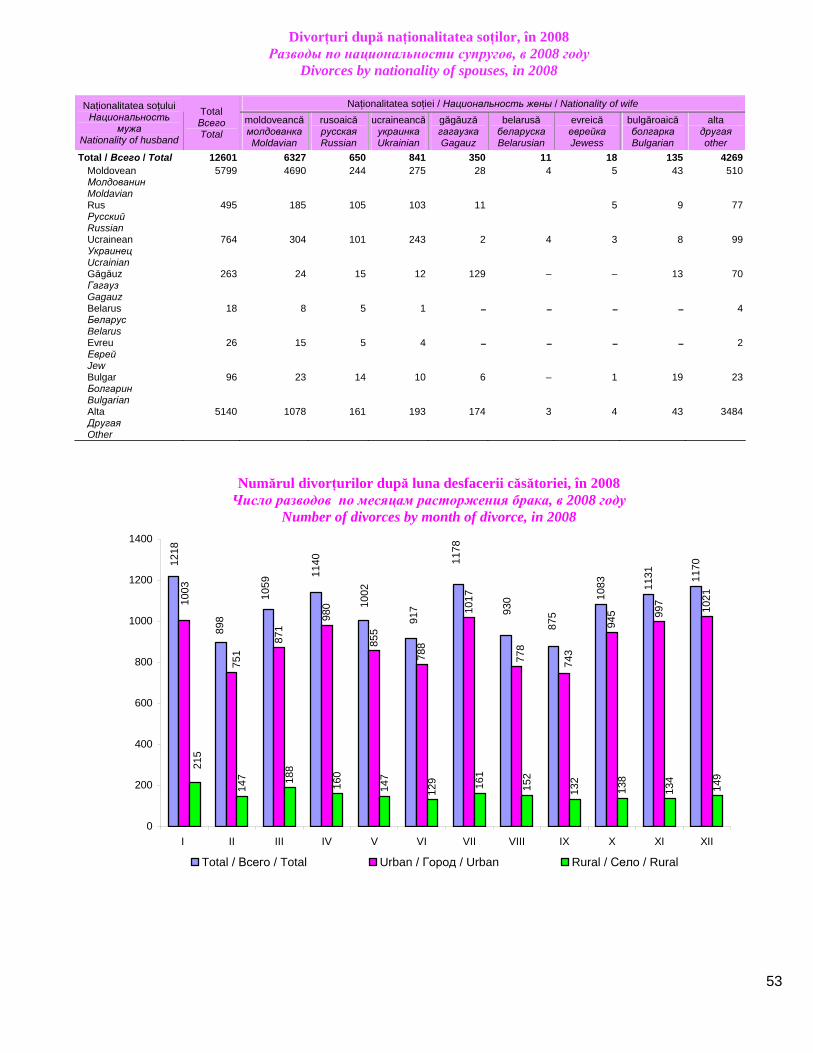
Căsătorii încheiate după naţionalitatea soţilor, în 2008
Заключенные браки по национальности супругов, в 2008 году Marriages by nationality of spouses, in 2008
Naţionalitatea soţiei / Национальность жены / Nationality of wife Naţionalitatea soţului Национальность
мужа Nationality of husband
Total Всего Total
moldo-veancă
молдован-ка
Moldavian
rusoaicăрусскаяRussian
ucrai-neancă украинкаUkrainian
găgăuzăгагаузкаGagauz
belarusăбеларускаBelarusian
evreică еврейкаJewess
bulgă-roaică
болгарка Bulgarian
alta другая other
Total / Всего / Total
26666
21233 1408 1787 1344 43
29
533 289
din care: / в том числе: / of which:
Moldovean Молдованин Moldavian
20775 18890 620 781 125 22 13 184 140
Rus Русский Russian
1285 584 328 241 46 8 8 47 23
Ucrainean Украинец Ucrainian
1718 777 251 576 34 8 6 43 23
Găgăuz Гагауз Gagauz
1367 140 68 61 1013 - - 72 13
Belarus Беларус Belarus
48 23 4 9 7 - 1 4 -
Evreu Еврей Jew
79 47 11 13 2 - 1 2 3
Bulgar Болгарин Bulgarian
469 164 44 37 54 - - 162 8
Alta Другая Other
925 608 82 69 63 5 - 19 79
47
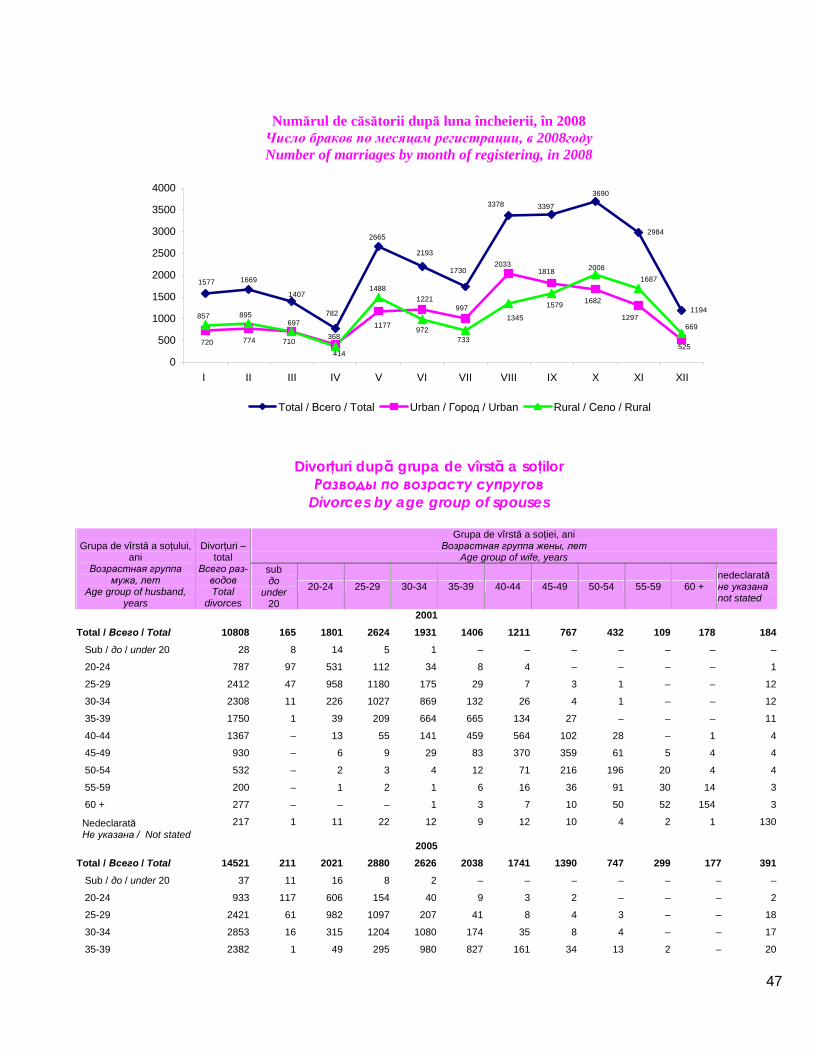
Numărul de căsătorii după luna încheierii, în 2008 Число браков по месяцам регистрации, в 2008году Number of marriages by month of registering, in 2008
2984
1194
1577 1669
1407
782
2665
2193
1730
3378 3397
3690
525720 774 710414
1177
1221997
20331818
1682
1297669
1687
857 895697
368
1488
972733
1345
1579
2008
0
500
1000
1500
2000
2500
3000
3500
4000
I II III IV V VI VII VIII IX X XI XII
Total / Всего / Total Urban / Город / Urban Rural / Село / Rural
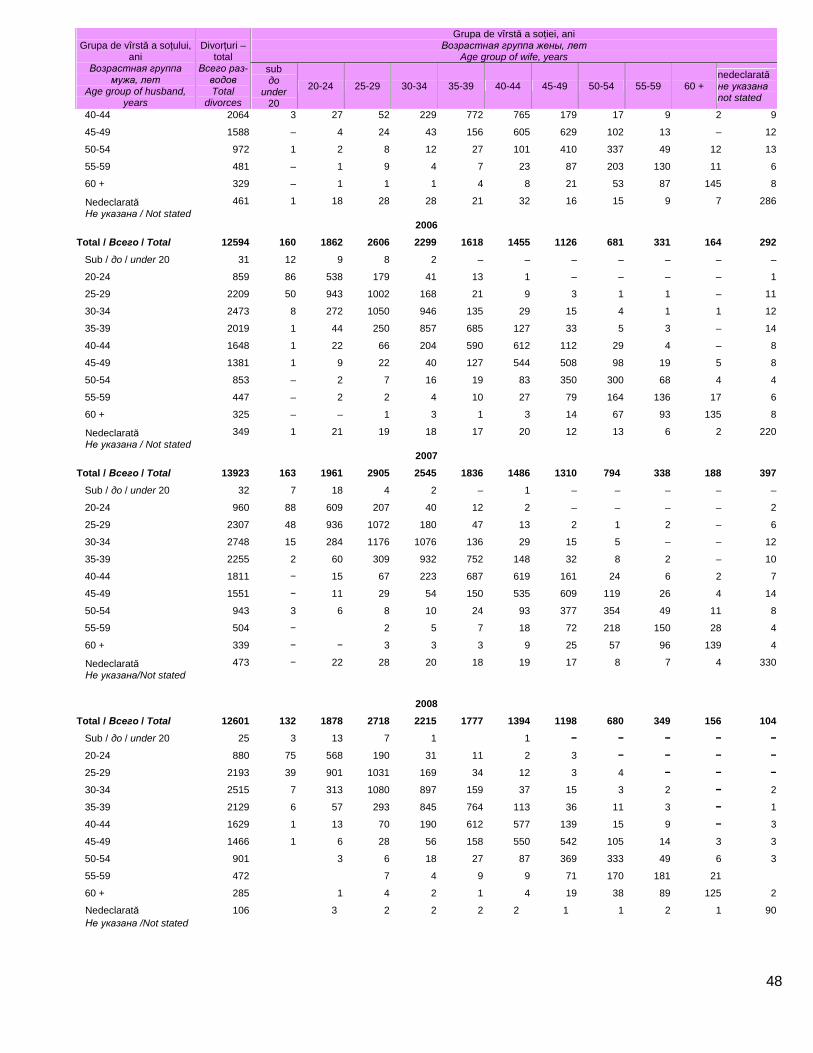
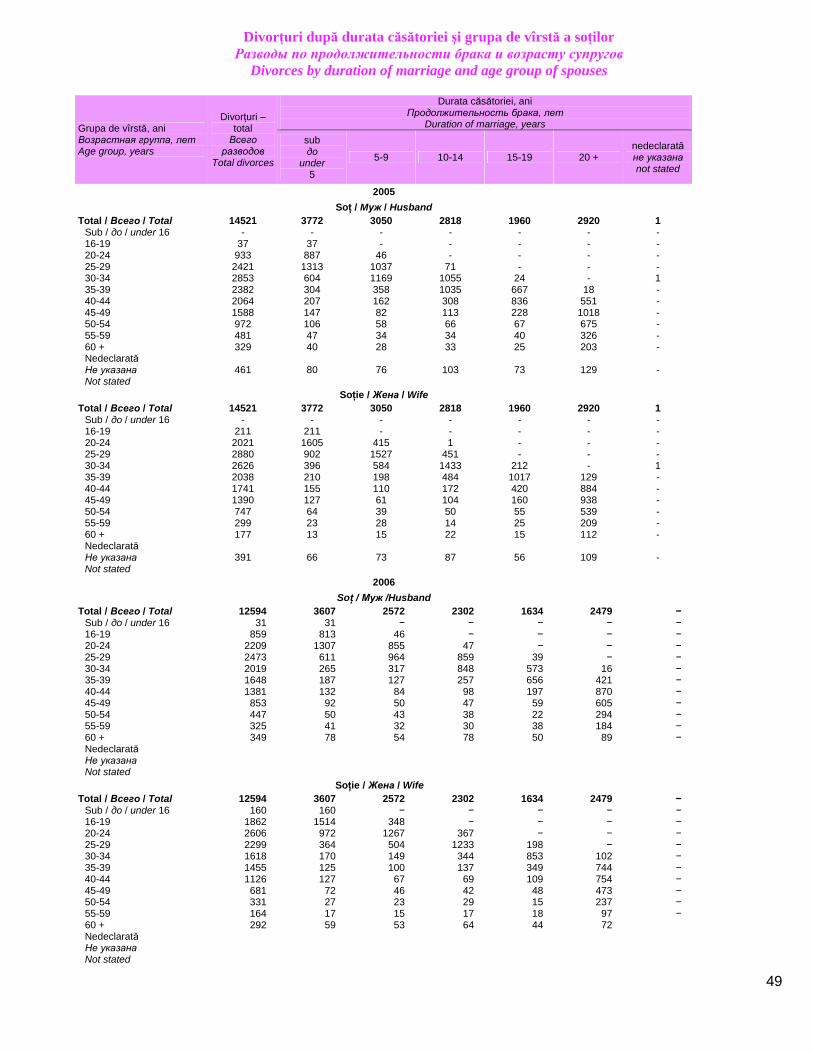
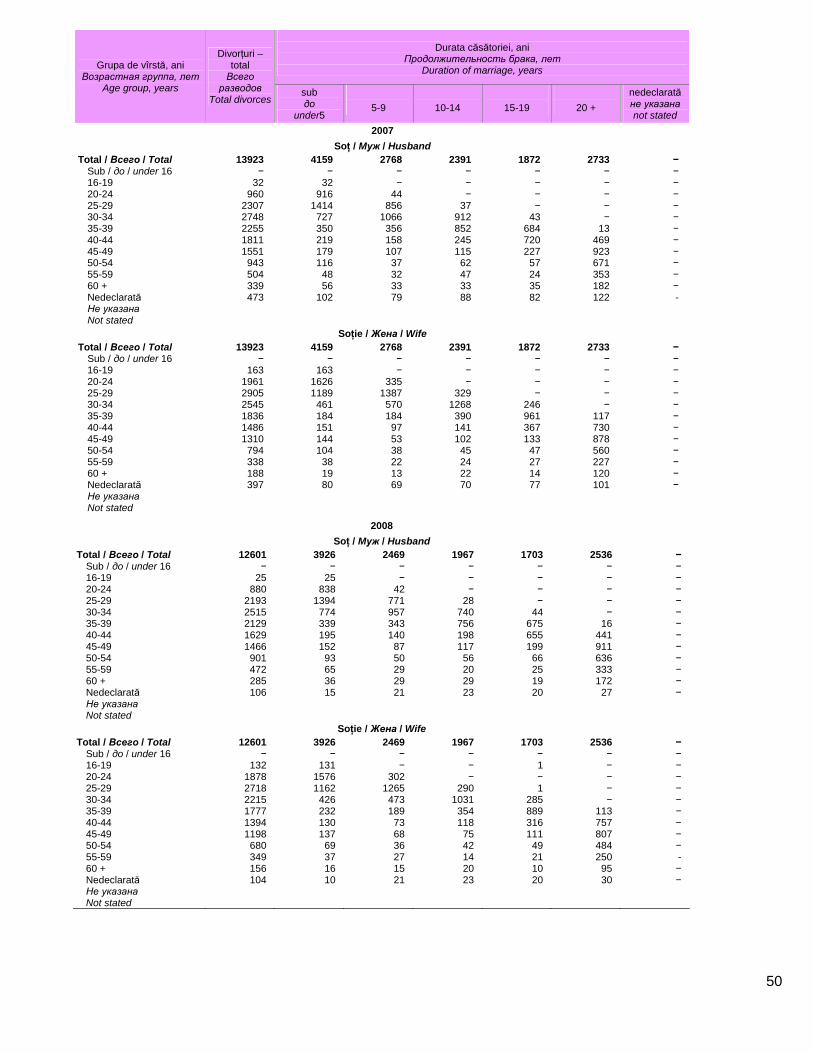
Divorţuri după grupa de vîrstă a soţilor Разводы по возрасту супругов
Divorces by age group of spouses
Grupa de vîrstă a soţiei, ani Возрастная группа жены, лет
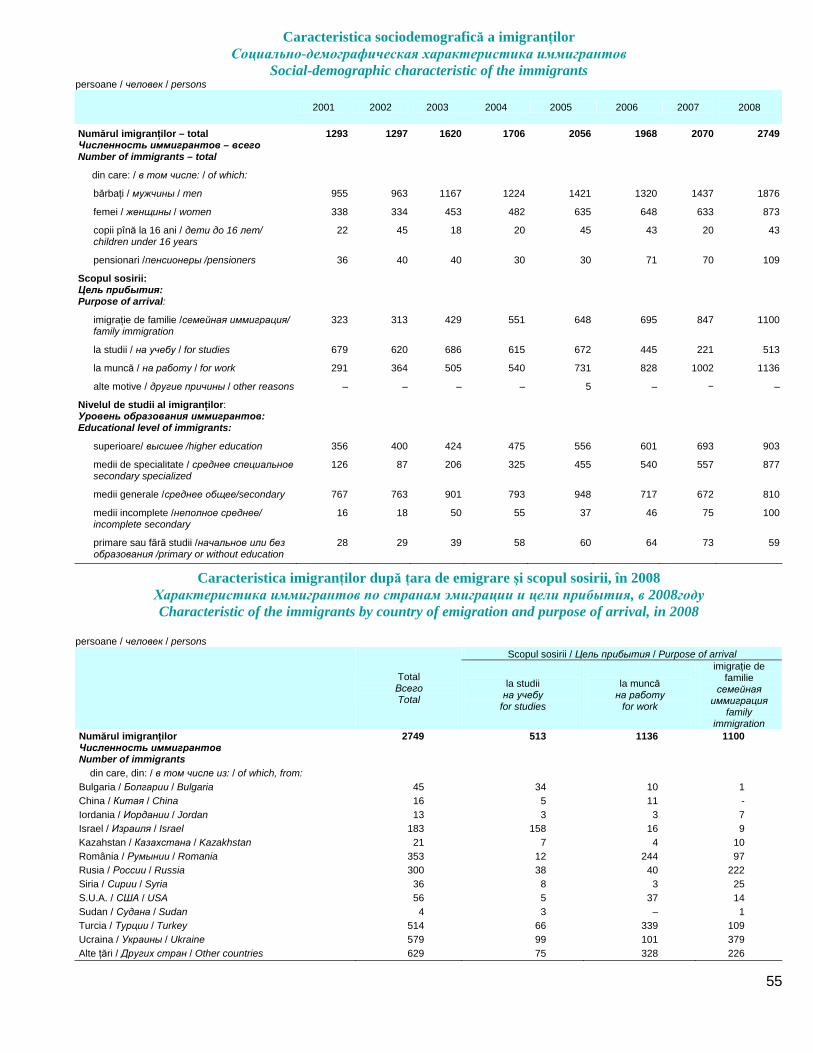
primare sau fără studii /начальное или без образования /primary or without education
28 29 39 58 60 64 73 59
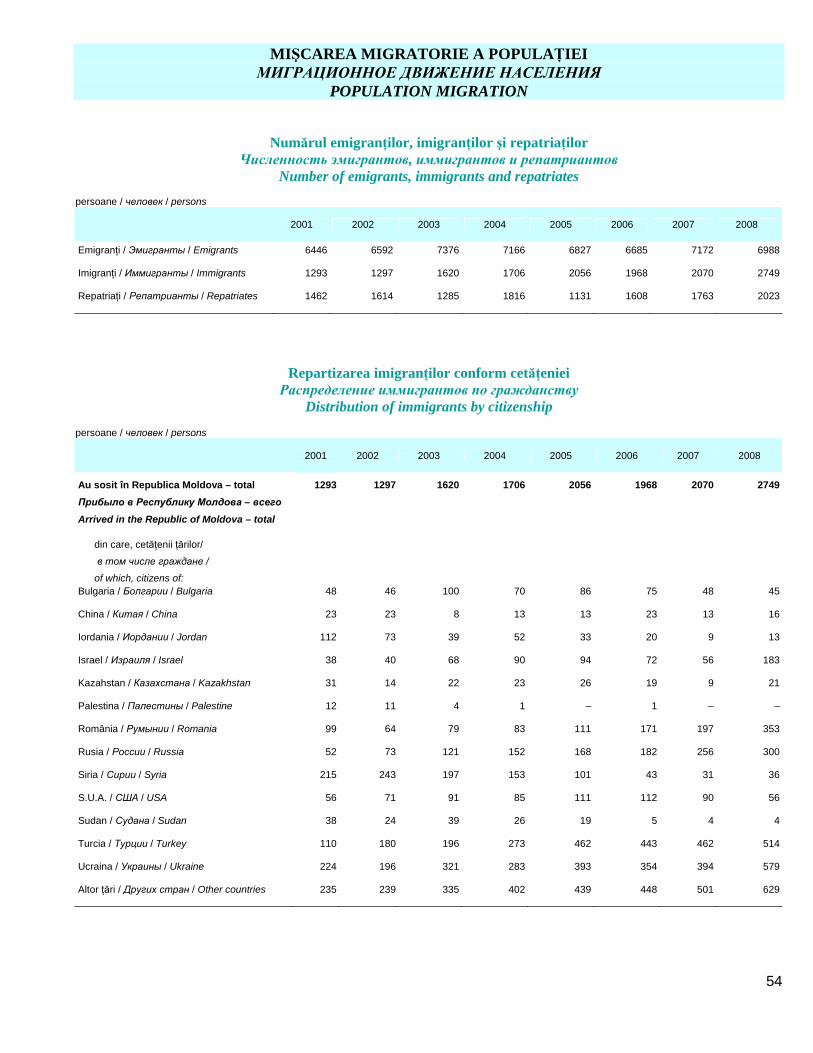
Caracteristica imigranţilor după ţara de emigrare şi scopul sosirii, în 2008 Характеристика иммигрантов по странам эмиграции и цели прибытия, в 2008году Characteristic of the immigrants by country of emigration and purpose of arrival, in 2008
persoane / человек / persons Scopul sosirii / Цель прибытия / Purpose of arrival
Total Всего Total
la studii на учебу
for studies
la muncă на работу
for work
imigraţie de familie
семейная иммиграция
family immigration
Numărul imigranţilor Численность иммигрантов Number of immigrants
2749 513 1136 1100
din care, din: / в том числе из: / of which, from: Bulgaria / Болгарии / Bulgaria 45 34 10 1 China / Китая / China 16 5 11 - Iordania / Иордании / Jordan 13 3 3 7 Israel / Израиля / Israel 183 158 16 9 Kazahstan / Казахстана / Kazakhstan 21 7 4 10 România / Румынии / Romania 353 12 244 97 Rusia / России / Russia 300 38 40 222 Siria / Сирии / Syria 36 8 3 25 S.U.A. / США / USA 56 5 37 14 Sudan / Судана / Sudan 4 3 – 1 Turcia / Турции / Turkey 514 66 339 109 Ucraina / Украины / Ukraine 579 99 101 379 Alte ţări / Других стран / Other countries 629 75 328 226
56
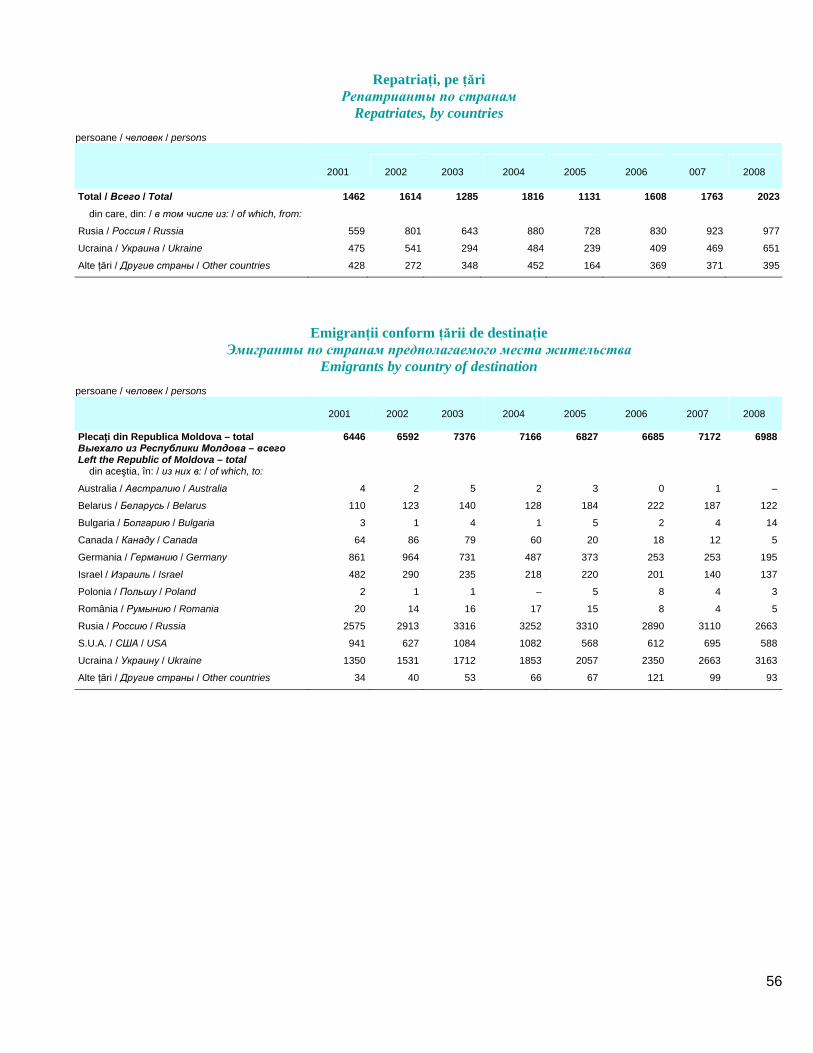
Repatriaţi, pe ţări Репатрианты по странам
Repatriates, by countries persoane / человек / persons
2001
2002
2003
2004
2005
2006
007
2008
Total / Всего / Total 1462 1614 1285 1816 1131 1608 1763 2023
din care, din: / в том числе из: / of which, from: Rusia / Россия / Russia 559 801 643 880 728 830 923 977